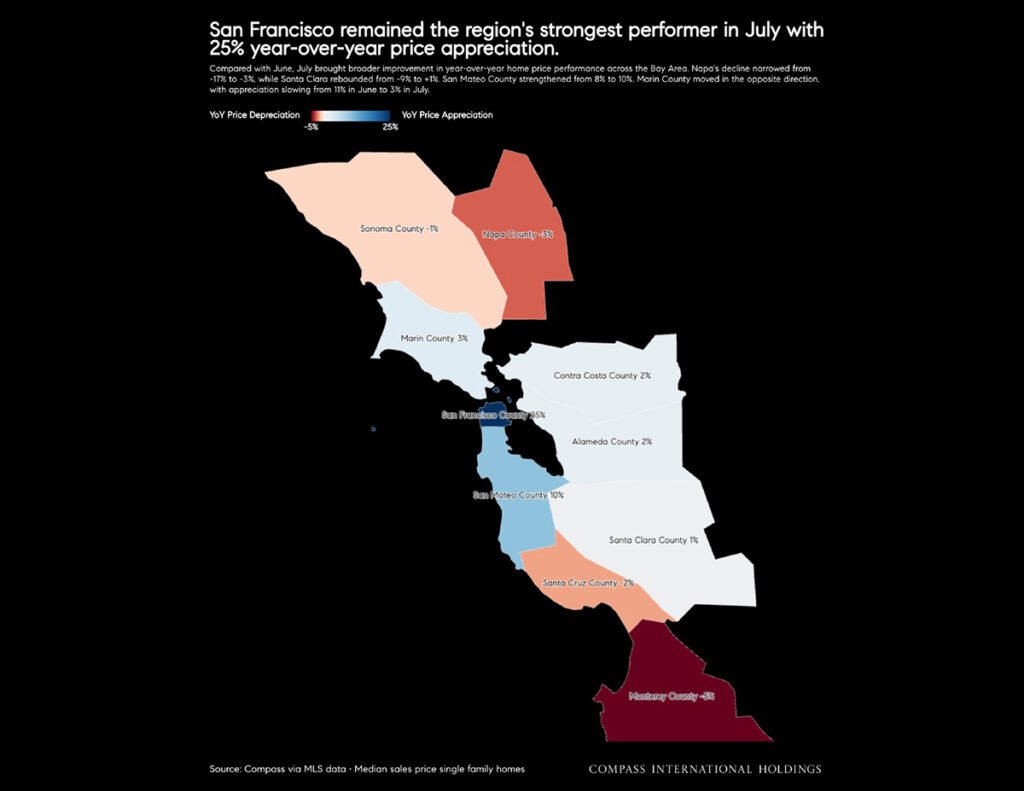
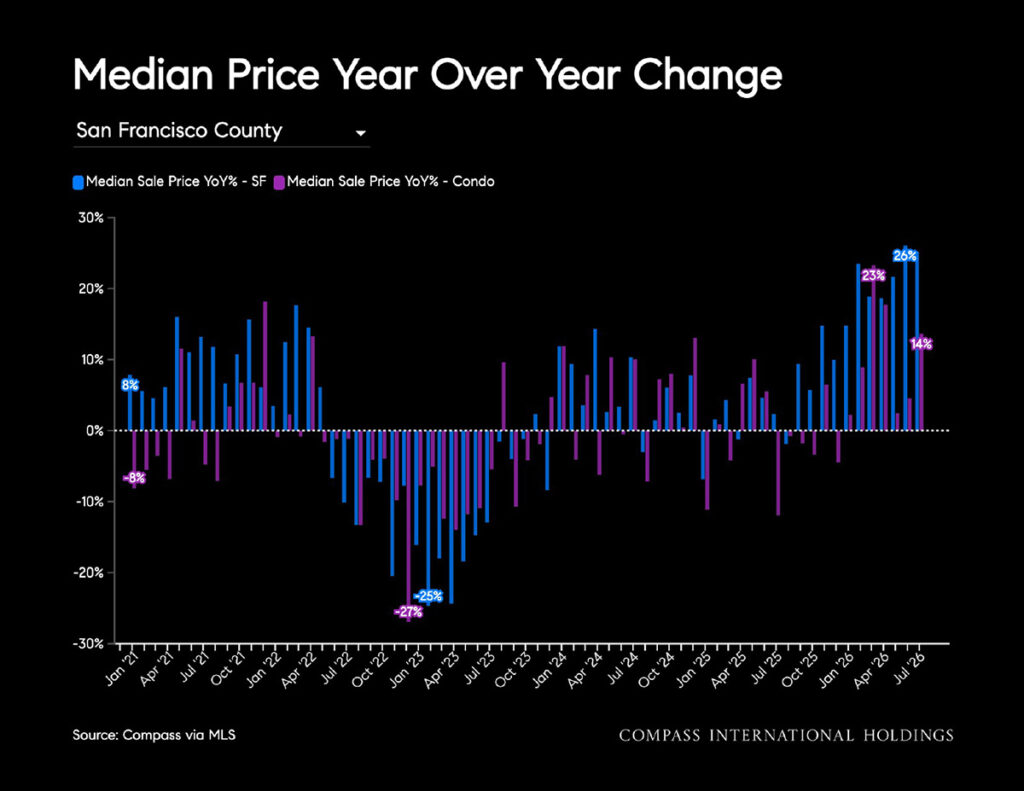
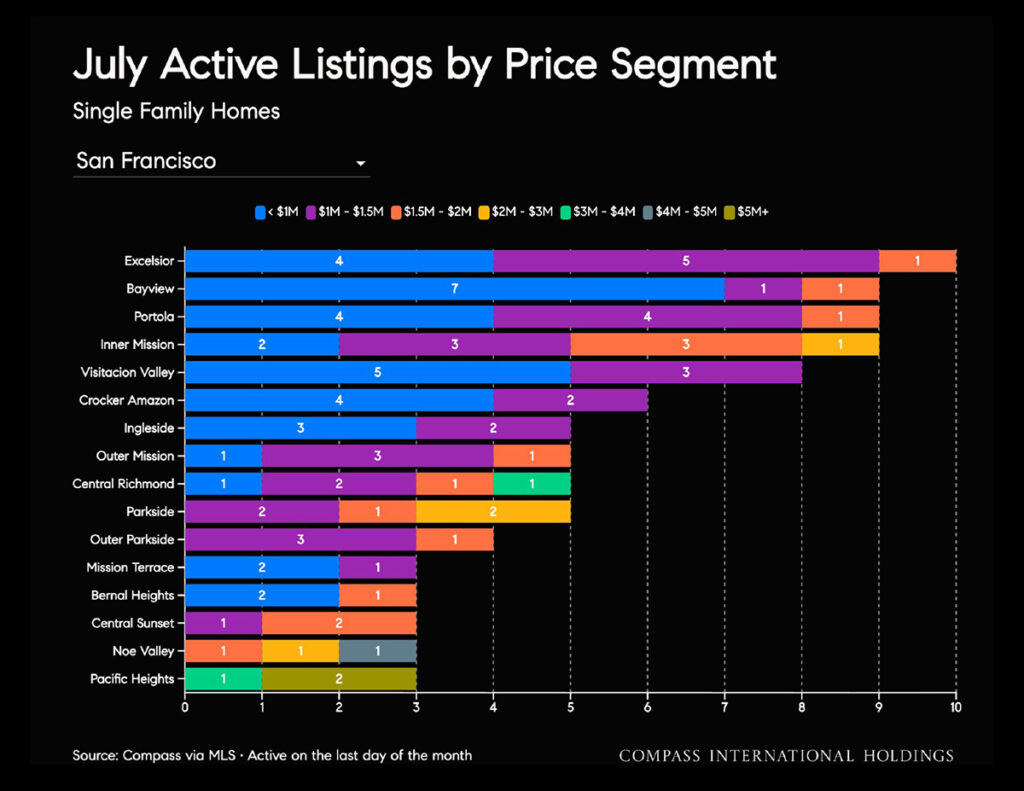
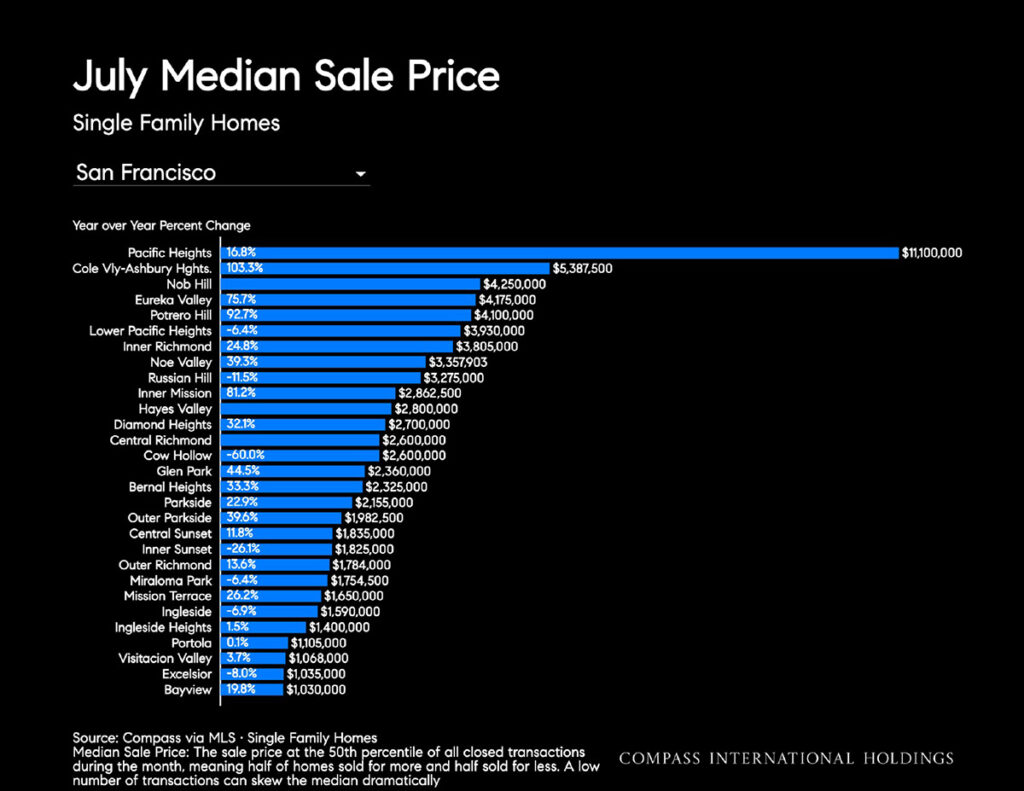
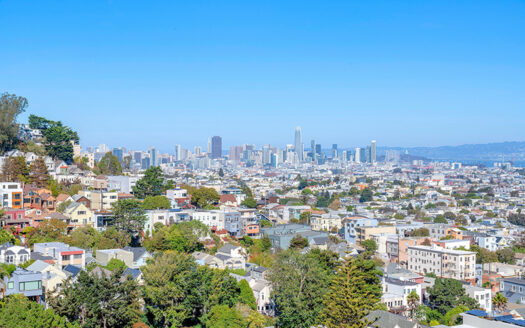
July ended with mortgage rates near their highs for the year, taking some momentum out of homebuyer demand regionally and nationally. But in San Francisco, sales have been driven more by wealth creation than by mortgage rates: the AI boom has spiked demand, especially for move-ready homes in popular neighborhoods. San Francisco’s median sales price is up 25% year-over-year; San Mateo County is up nearly 10%. Job creation in San Francisco is fueling demand here, while sluggish hiring elsewhere in the region means less demand. As is frequently the case, the local market is diverging from both regional and national trends.
With the fall market around the corner, we should see the typical inventory increase after Labor Day. With plenty of buyer demand in the market, the fall promises to be busy.
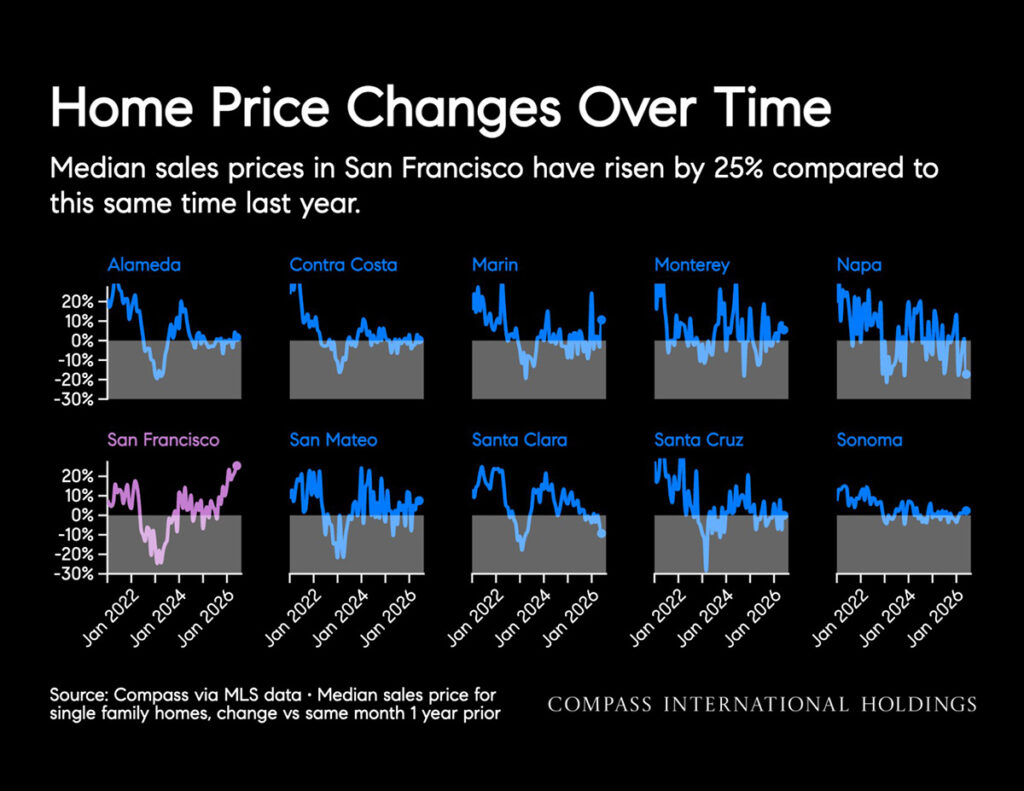
Bay Area Home Price Changes Over Time
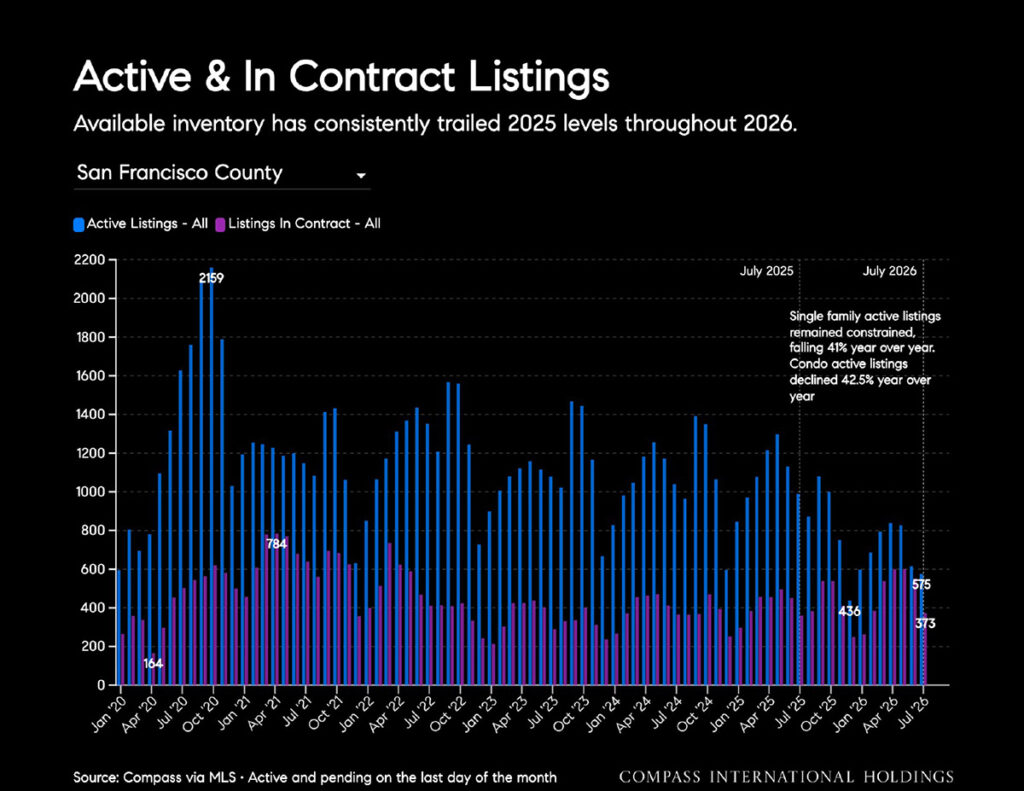
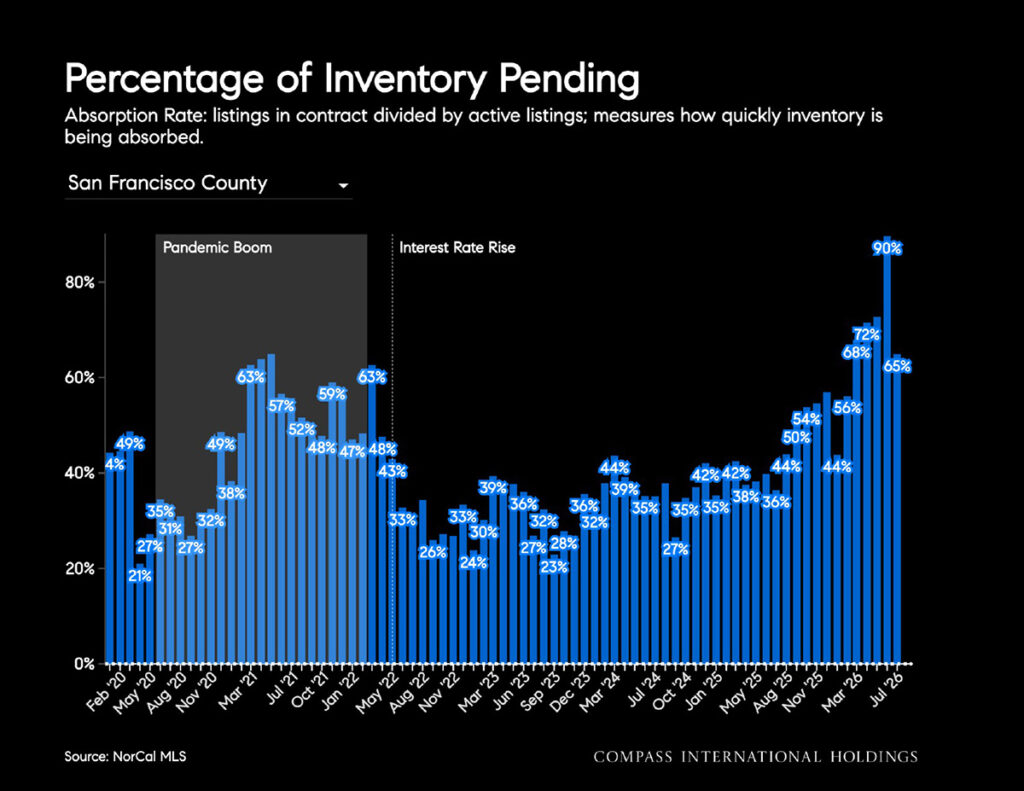
Active Listings and Pending Sales
Inventory remained constrained for single family homes, falling 41% year over year, though it increased 2.6% from last month. Condo inventory declined 42.5% year over year and 9.9% month over month.
Median Price Year Over Year Change
The median sale price for single family homes increased 25.2% year over year but declined 4.7% month over month to $2.05 million.
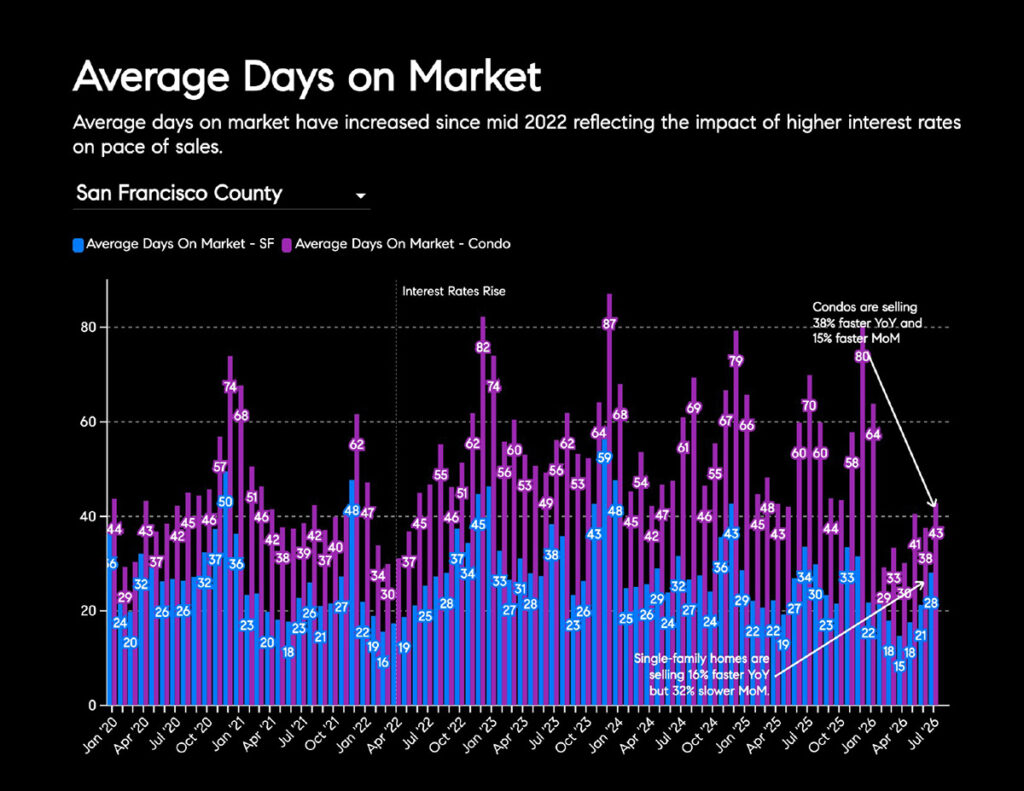
Average Days on Market
Average days on market for single family homes declined 16.2% year over year but increased 32.1% month over month to 28 days. For condos average days on market fell 38.0% year over year but rose 15.3% month over month to 43.3 days.
SINGLE FAMILY HOMES
Median Sales Price
The median sale price increased 25.2% year over year but declined 4.7% month over month to $2.05 million.
Closed Sales
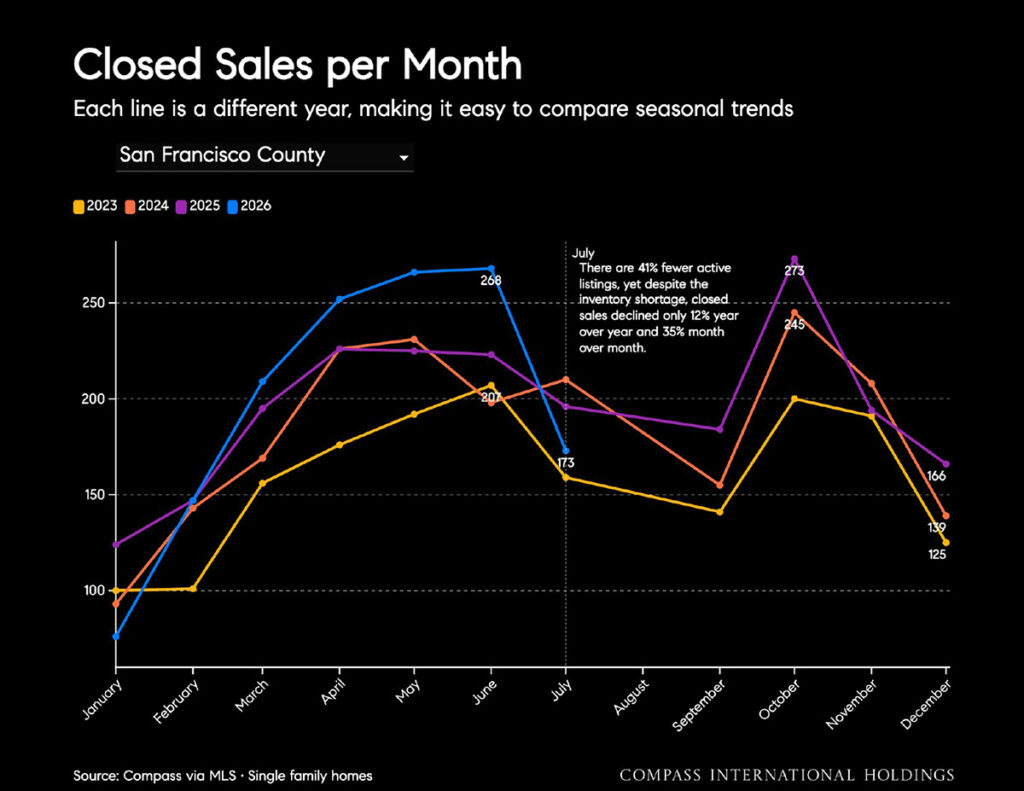
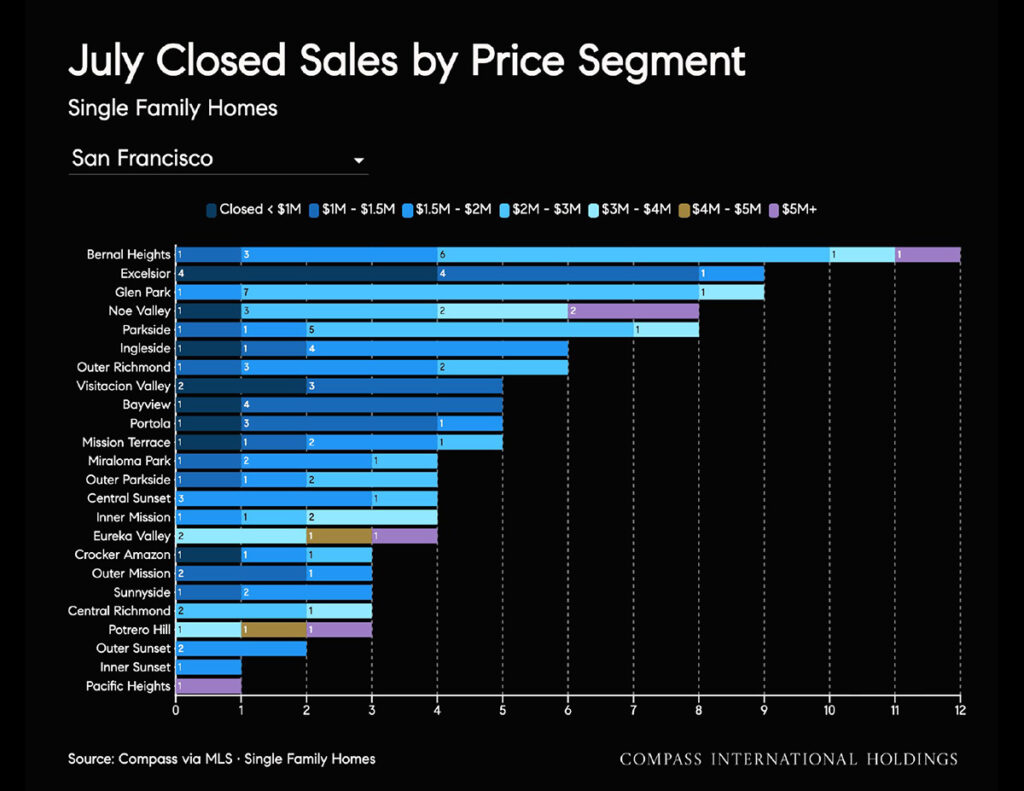
Closed sales declined 11.7% year over year and 35.4% month over month to 173 transactions , while pending sales fell 11.2% year over year and 32.7% from June to 150.
Price per Square Foot
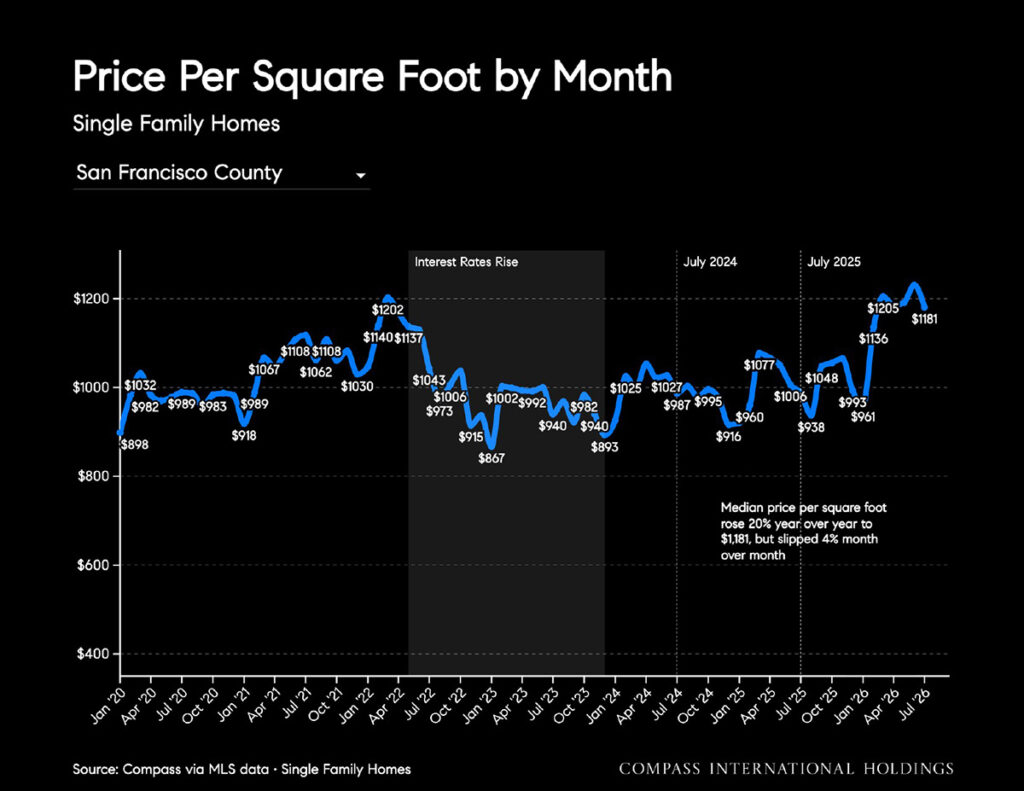
Median price per square foot rose 19.6% year over year to $1,181 , but slipped 4.0% month over month.
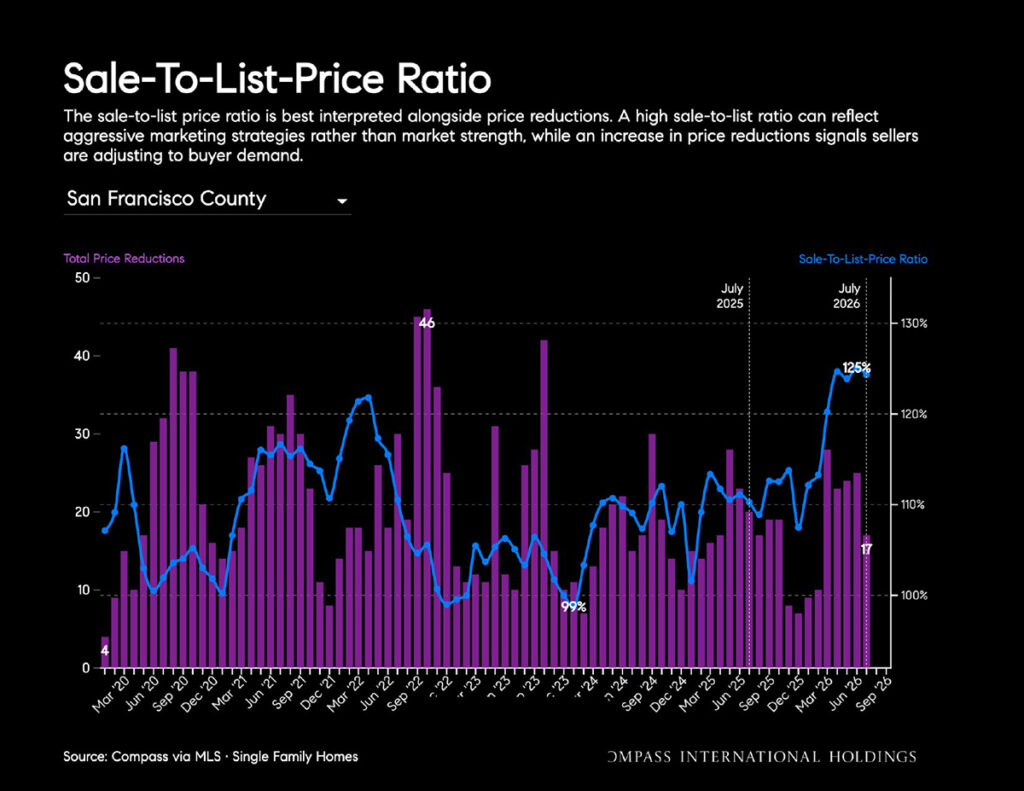
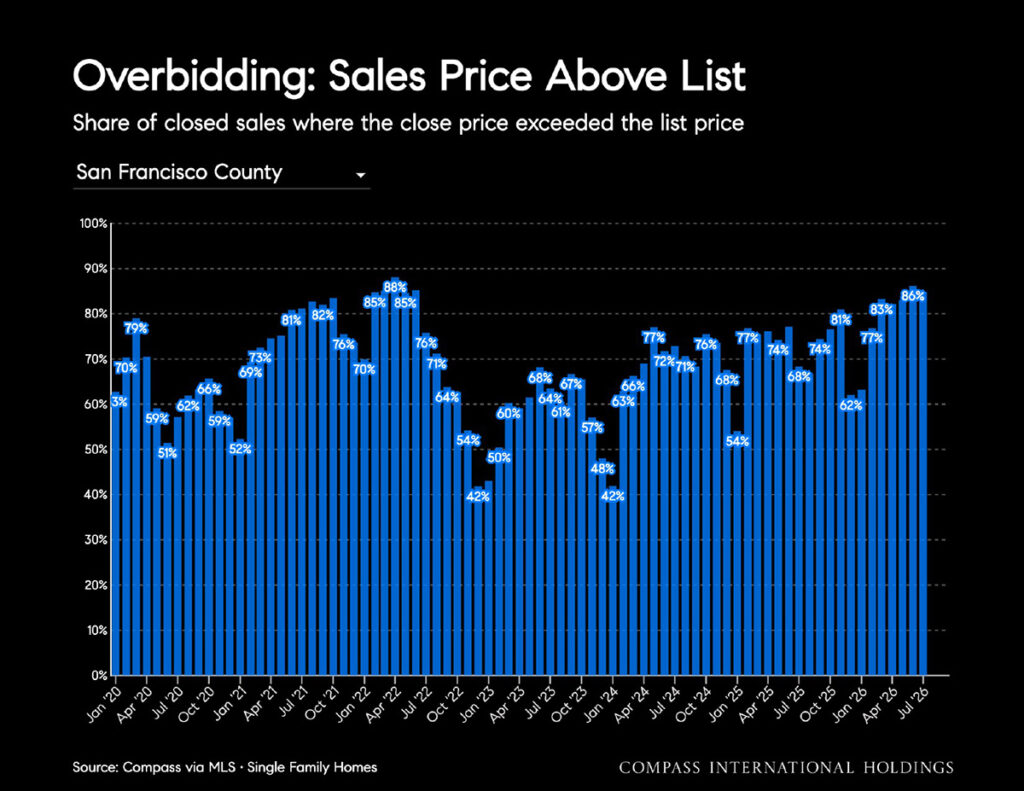
Sale to List Price Ratio
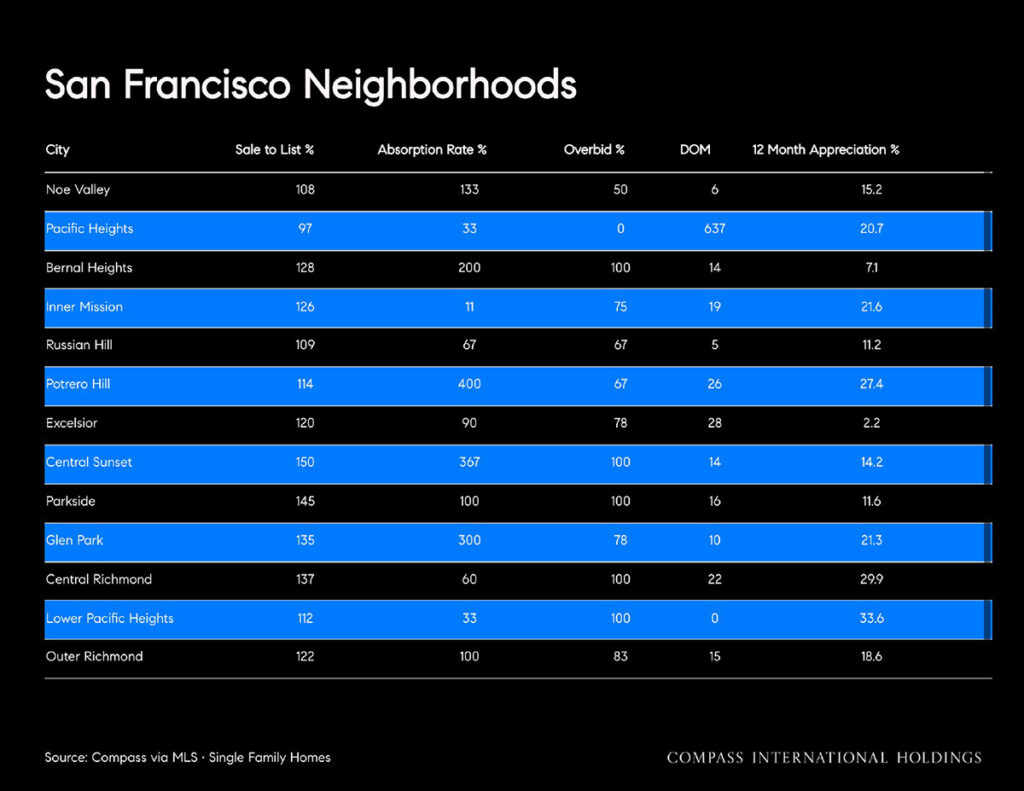
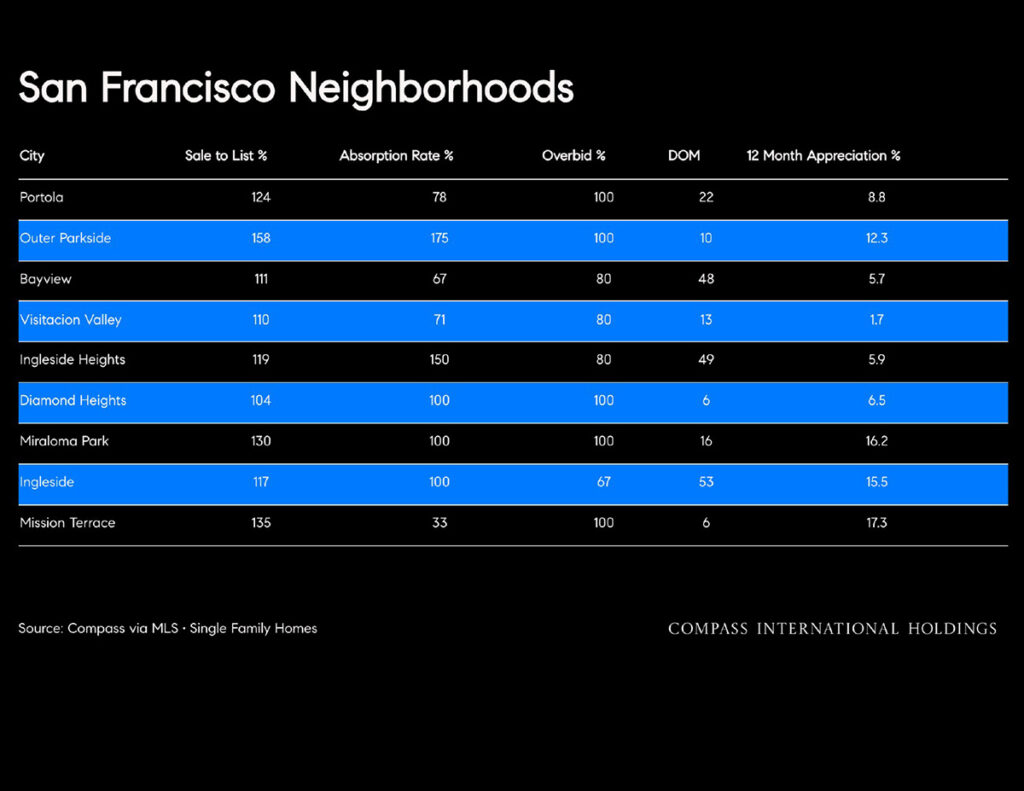
Sales by Select Neighborhoods
CONDOS
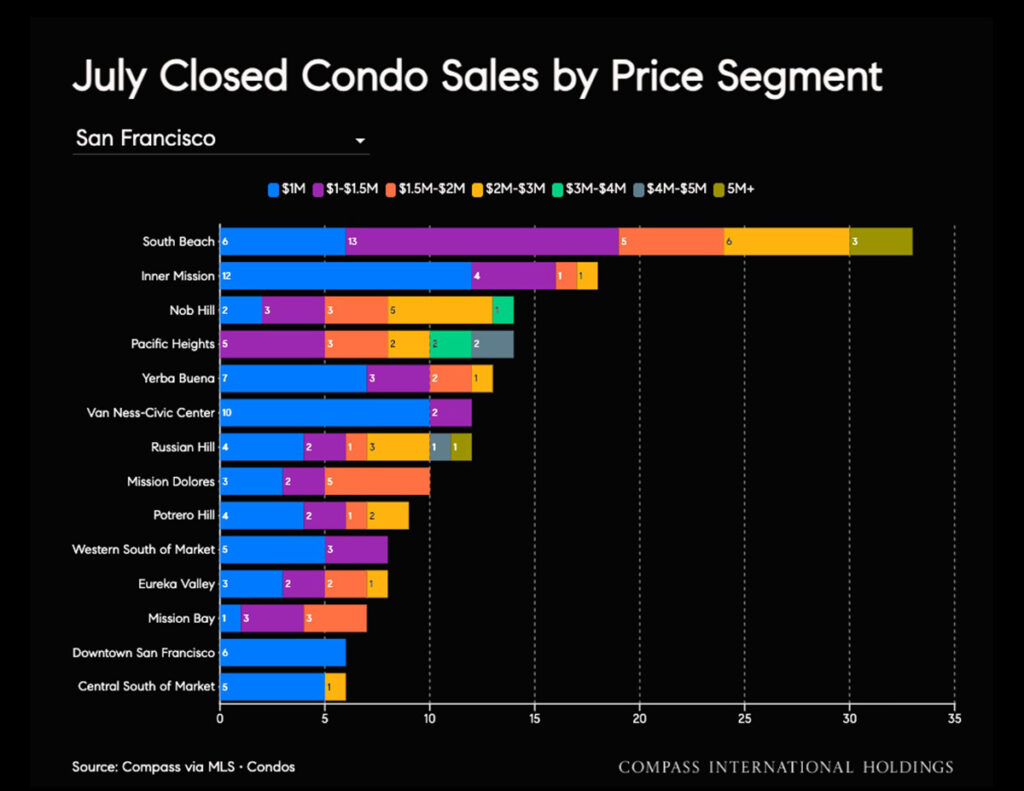
Closed Sales
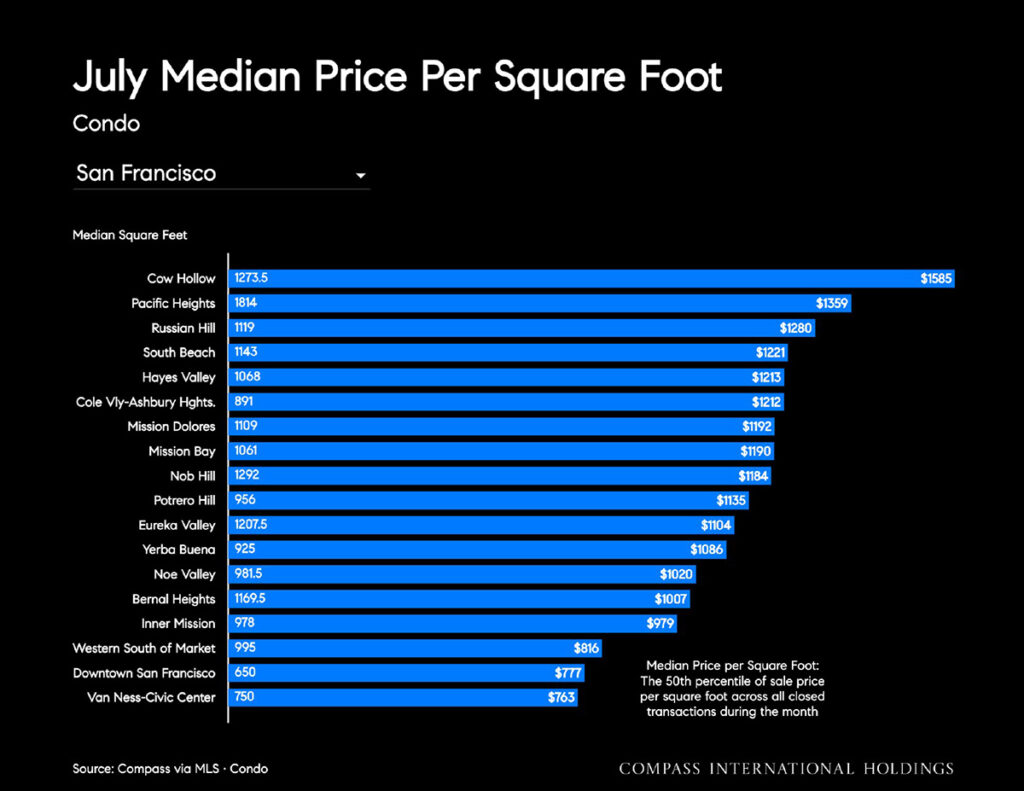
Price per Square Foot and Median Square Feet
Median price per square foot rose 13.1% year over year to $1,103 but fell 2.1% month over month.
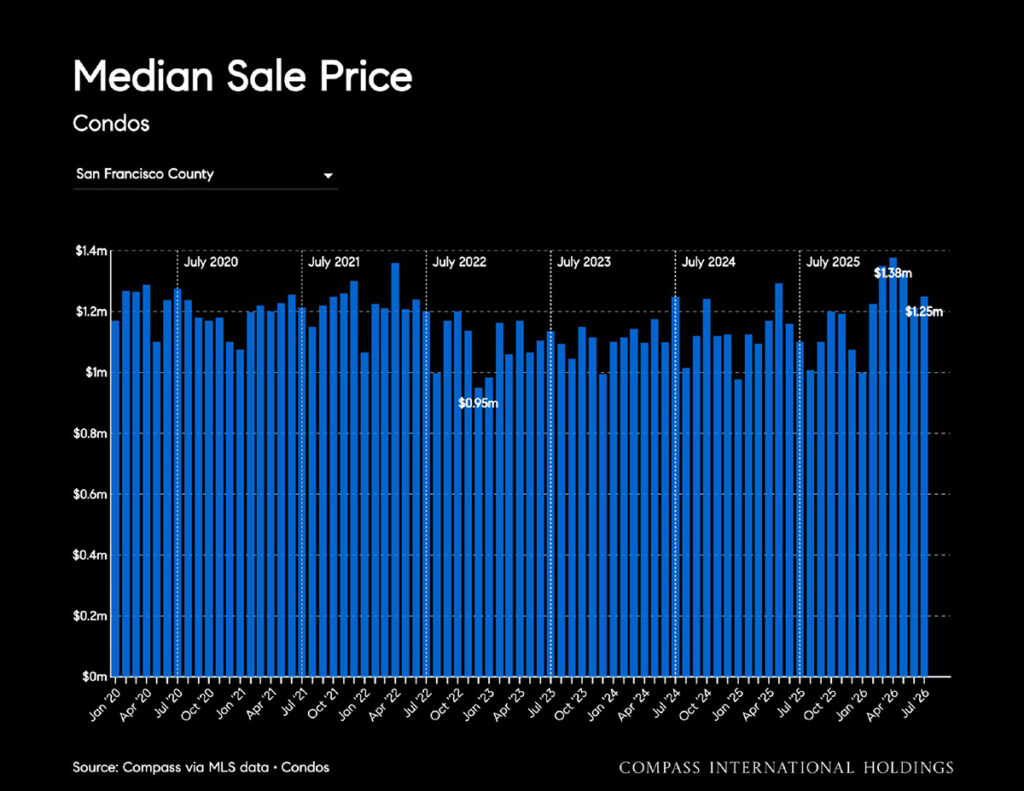
Median Sale Price
The median condo sale price increased 13.6% year over year and 3.1% month over month to $1.25 million.
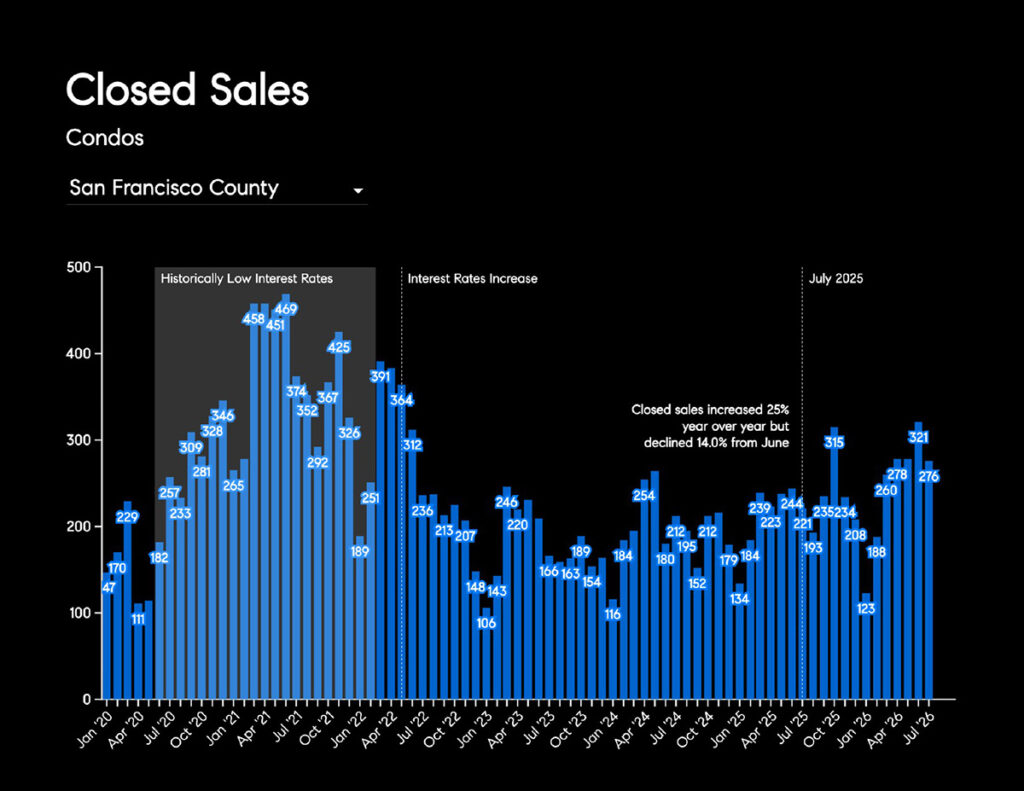
Closed Sales
Closed sales increased 24.9% year over year but declined 14.0% from June to 276 transactions, while pending sales rose 15.7% year over year and fell 32.6% month over month to 221.
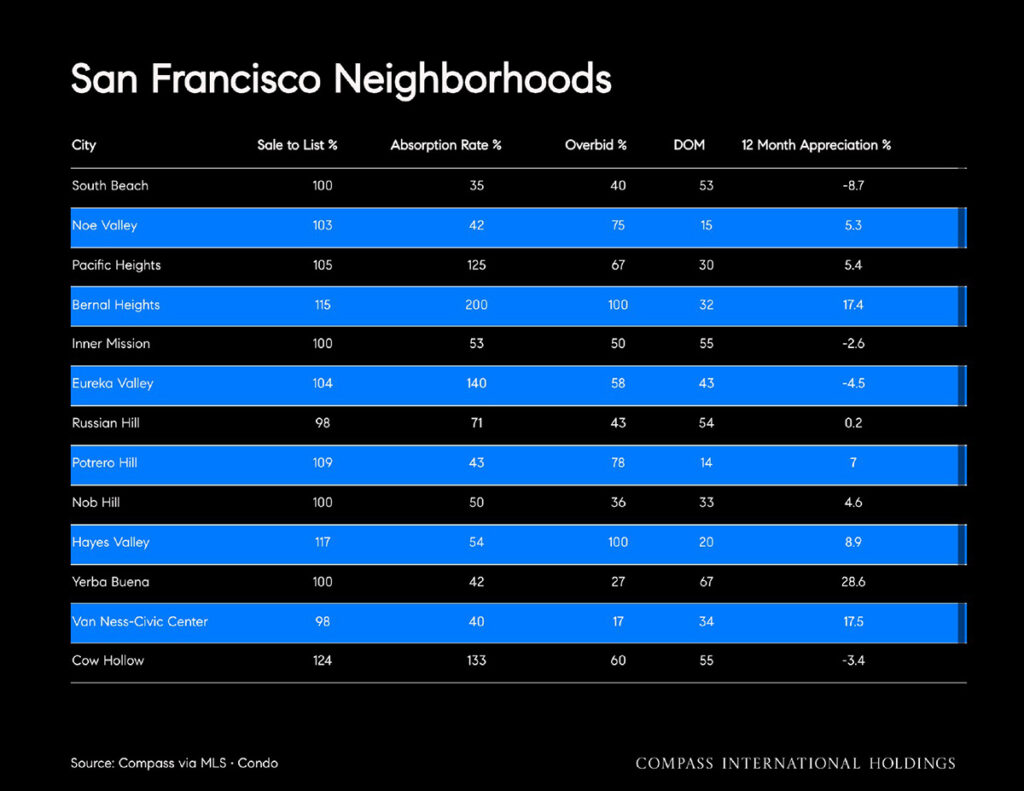
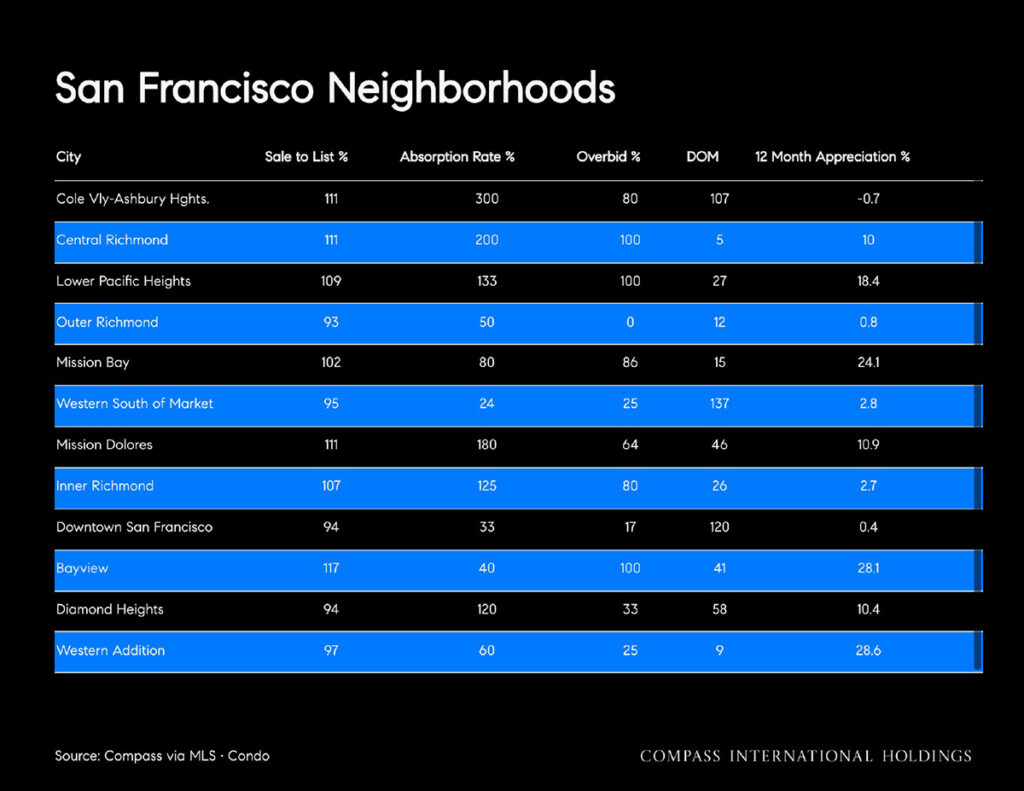
Sales by Select Neighborhoods
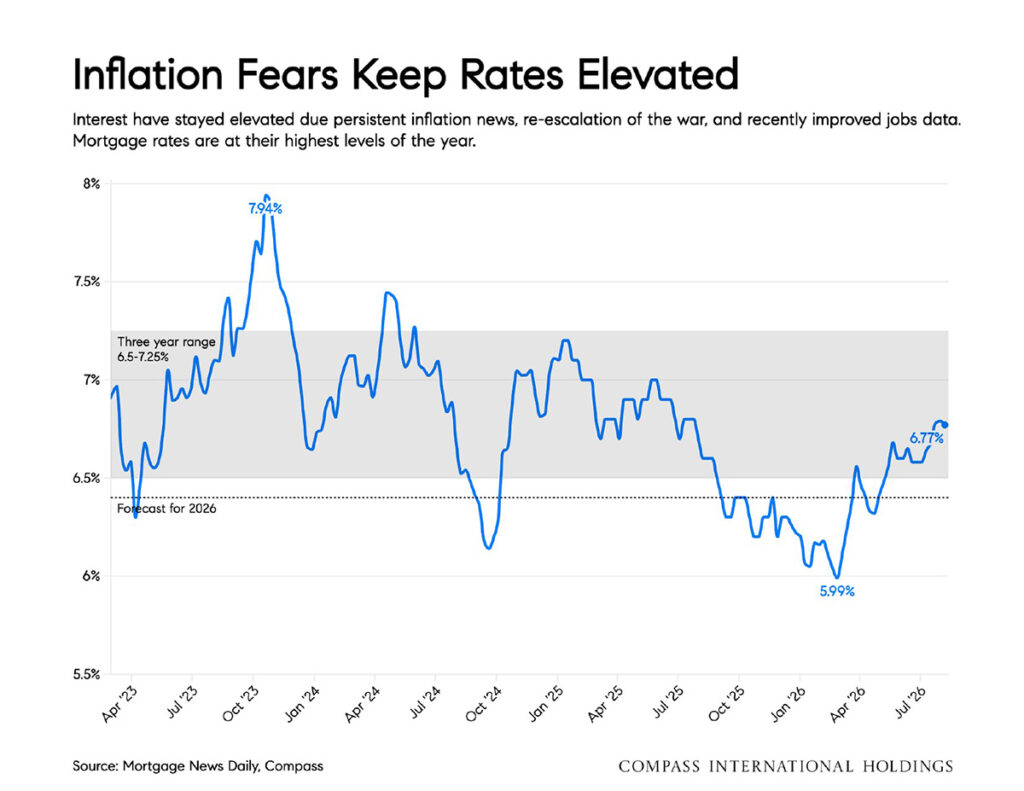
Mortgage Rates
Freddie Mac reported as of August 13, 2026 that the 30-year fixed-rate mortgage averaged 6.67%, down from last week when it averaged 6.69%. A year ago at this time, the 30-year FRM averaged 6.58%.
The information herein is based on or derived from information generally available to the public and/or from sources believed to be reliable. No representation or warranty can be given with respect to the accuracy or completeness of the information.