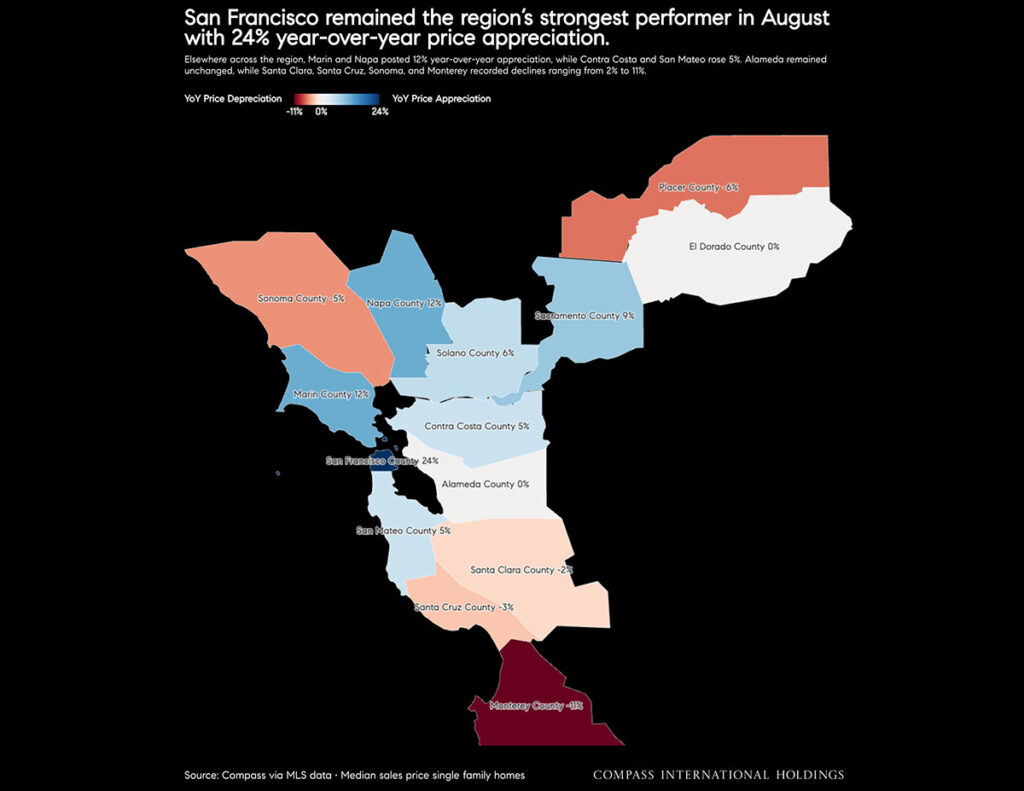
While demand remains high, sales continue to be constrained by lower inventory in the city. In August, San Francisco’s active inventory fell 35% year-over-year, the sharpest inventory decline in the region.
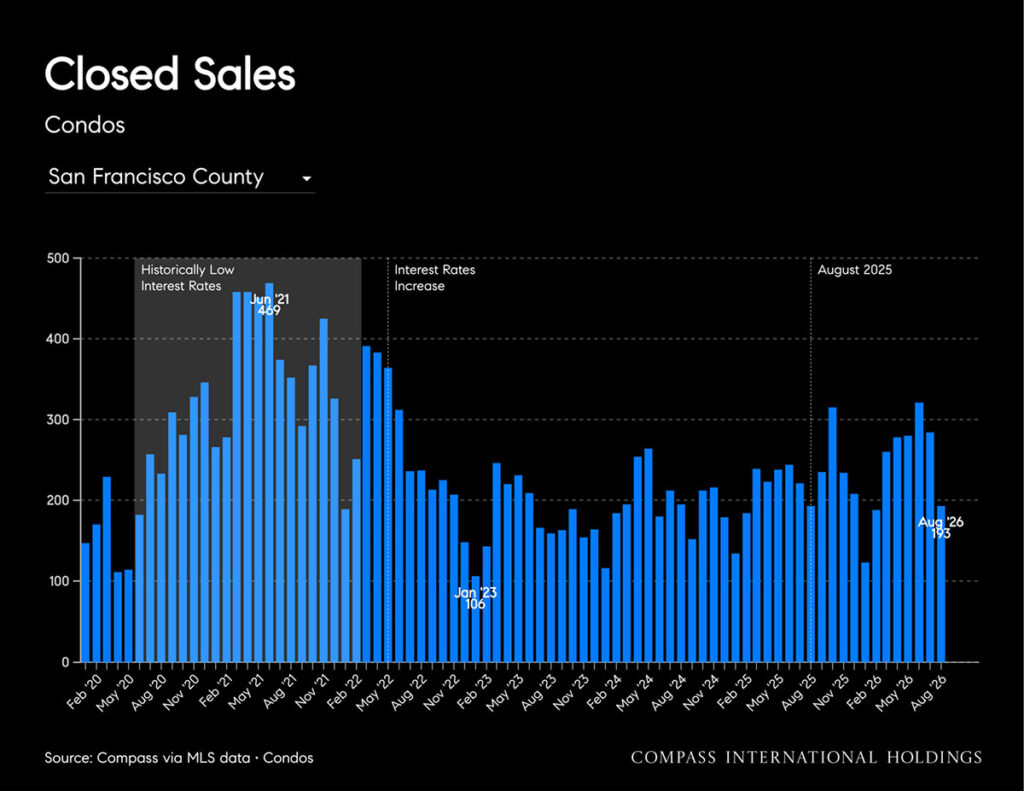
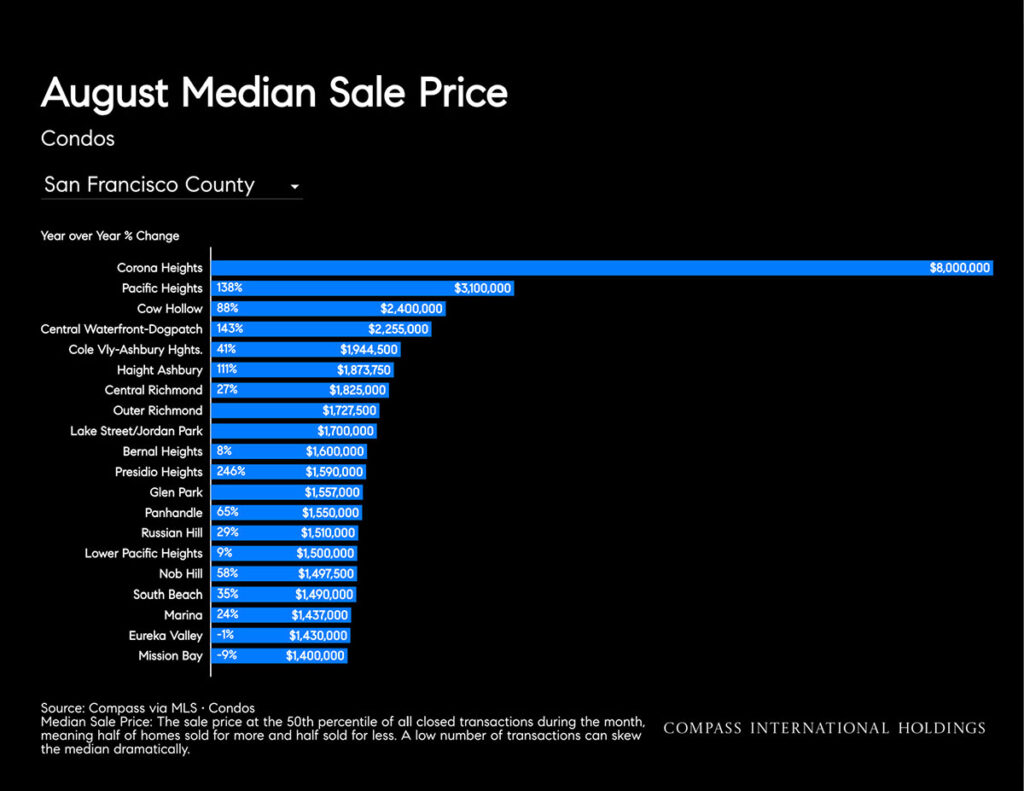
However, San Francisco was the only Bay Area county where condos showed both price and sales growth. Condo sales increased 11% year-over-year and the condo median sales price rose 22%.
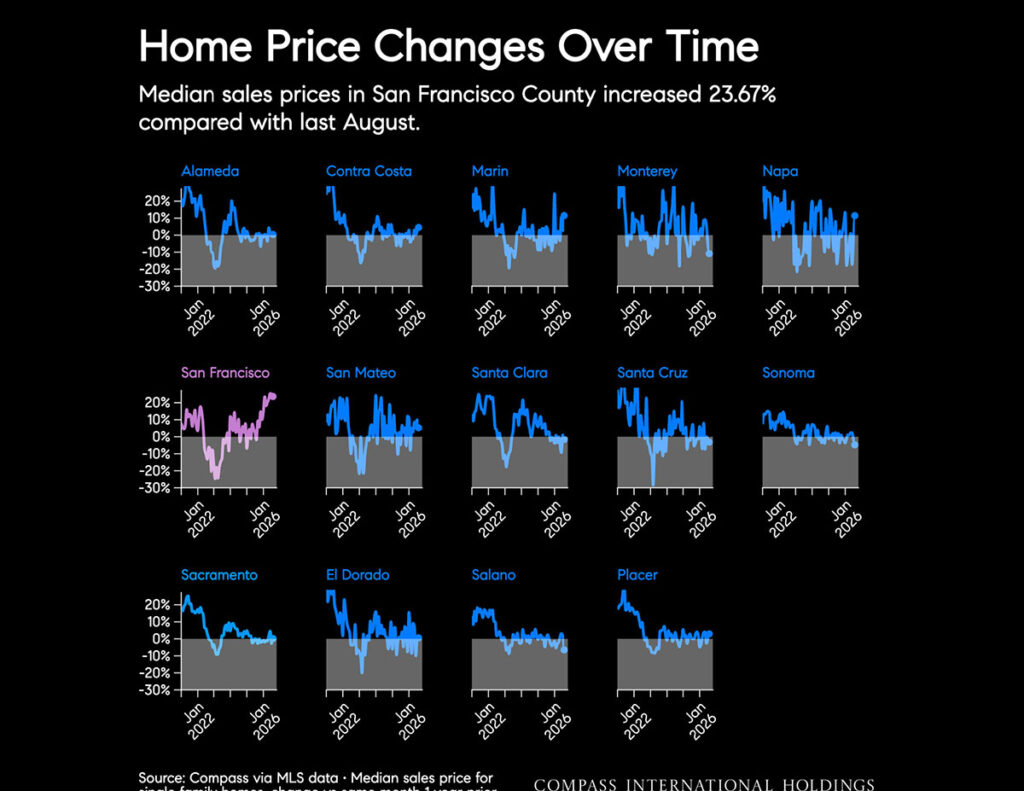
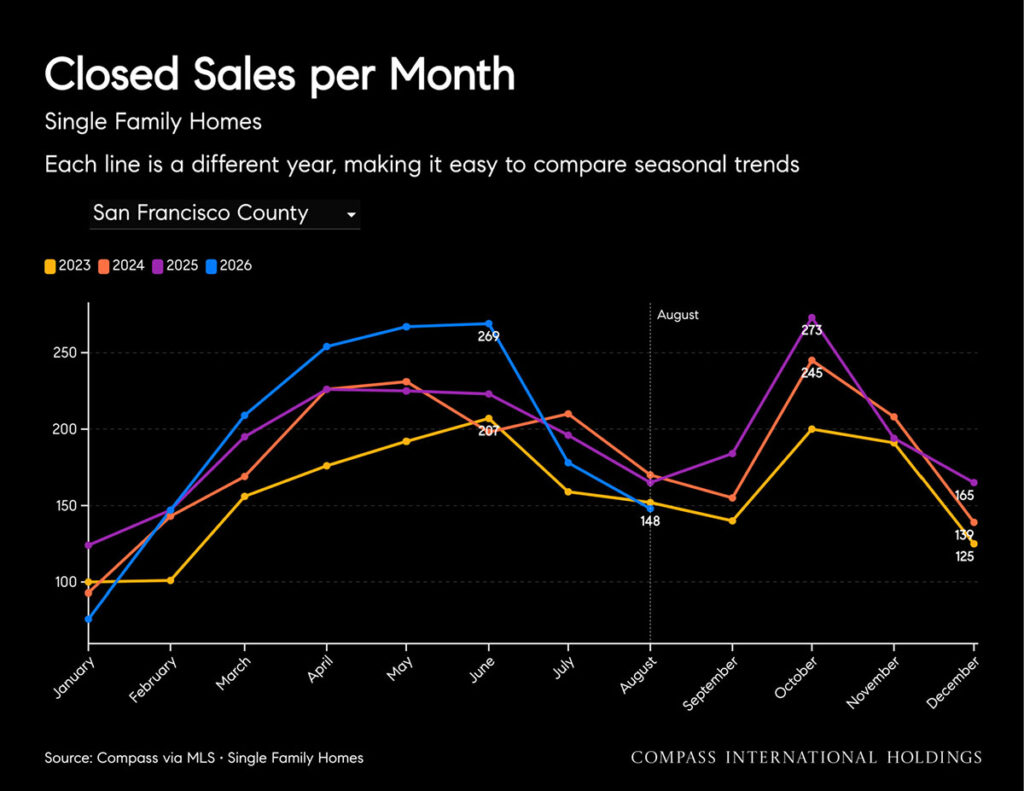
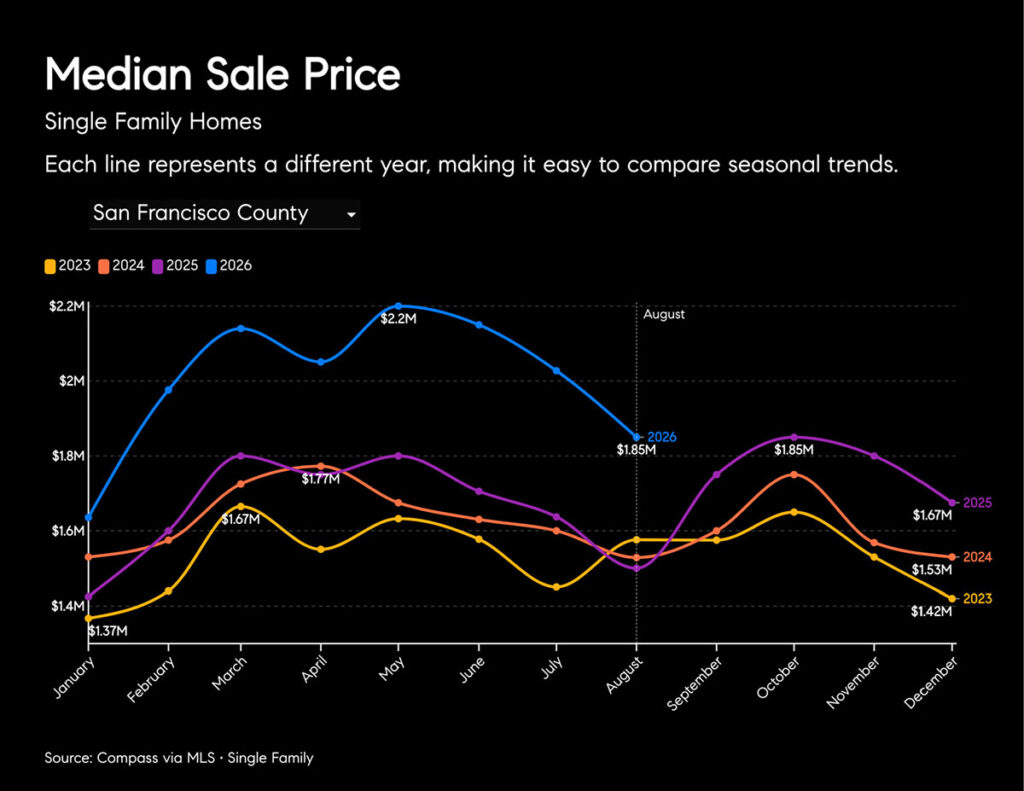
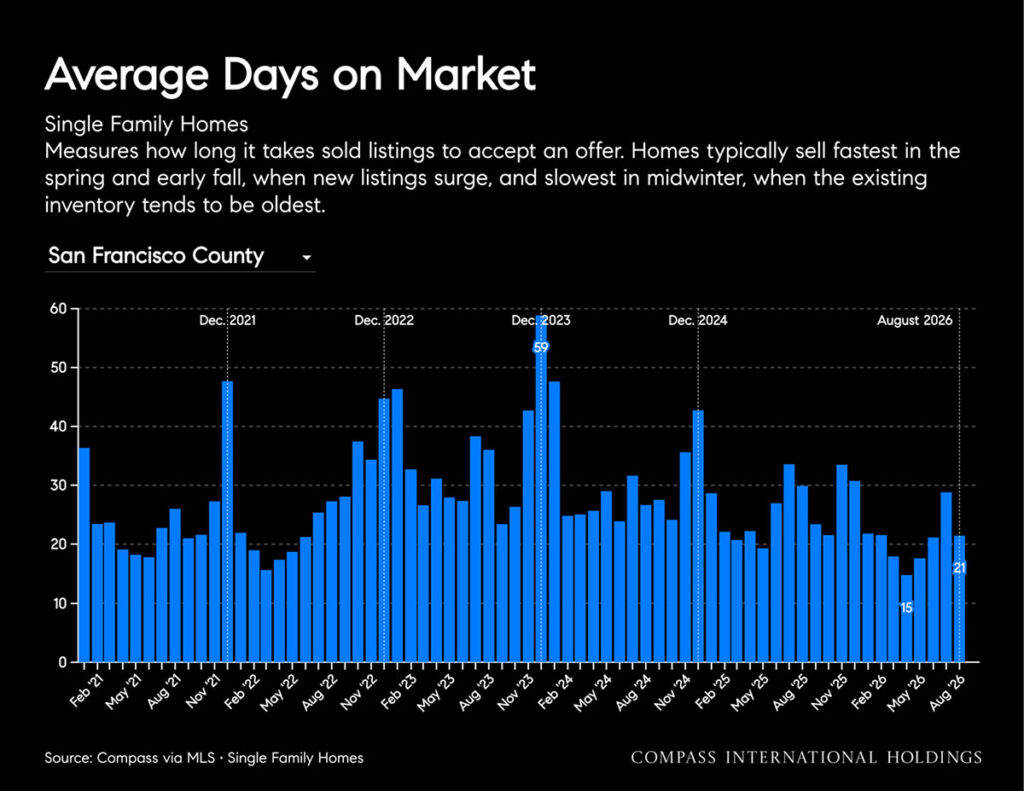
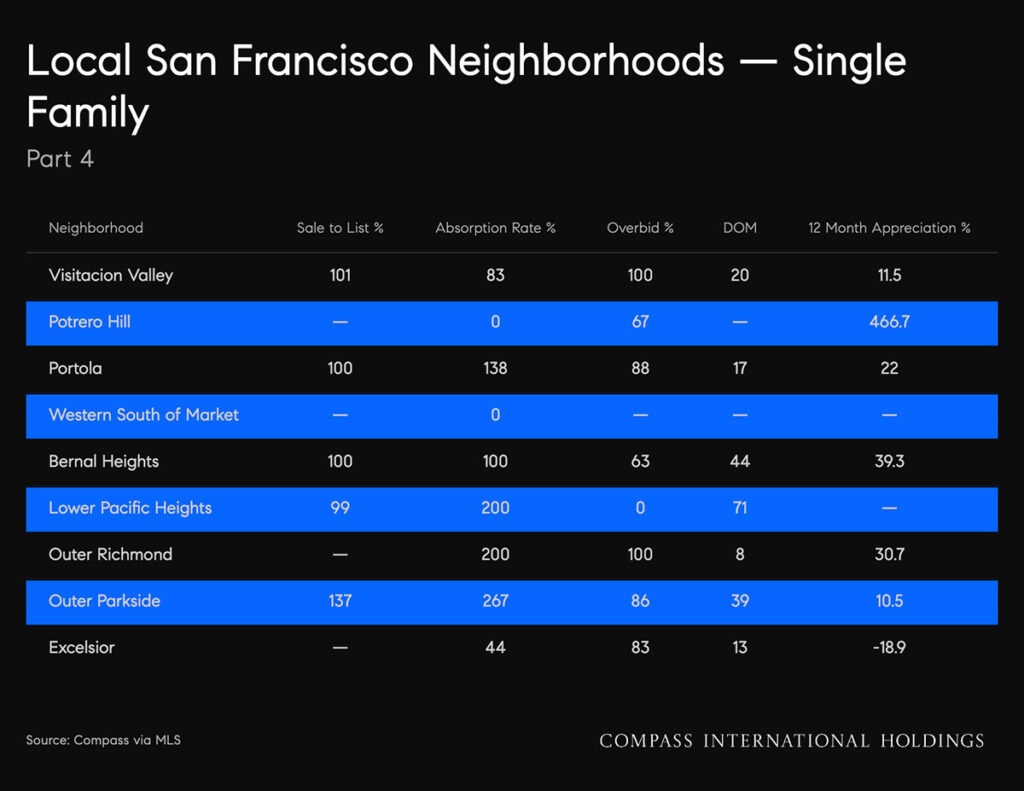
Compared to last year, single-family home sales fell 9% (due to lower supply), the median sale price rose 24%, and days on market fell from 30 to 21 days.
Inventory typically increases in September, after the Labor Day holiday. With mortgage rates inching about 7% and the possibility of a Fed rate hike, sales figures for the month of September and October will be an indication of how the market is faring before the holiday slowdown starts in November.
Bay Area Home Price Changes Over Time
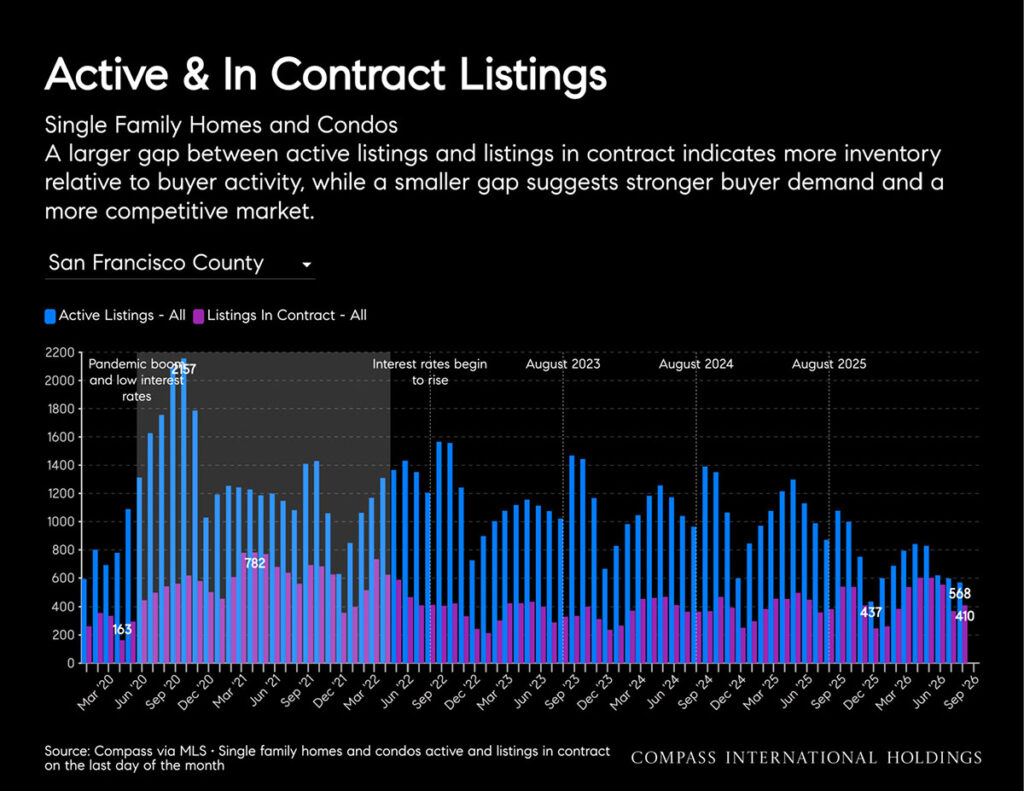
Active Listings and Pending Sales
Combined active listings plunged 35% YoY to 570 despite a 10% increase in new listings. Single-family actives fell 31% and condos 36%.
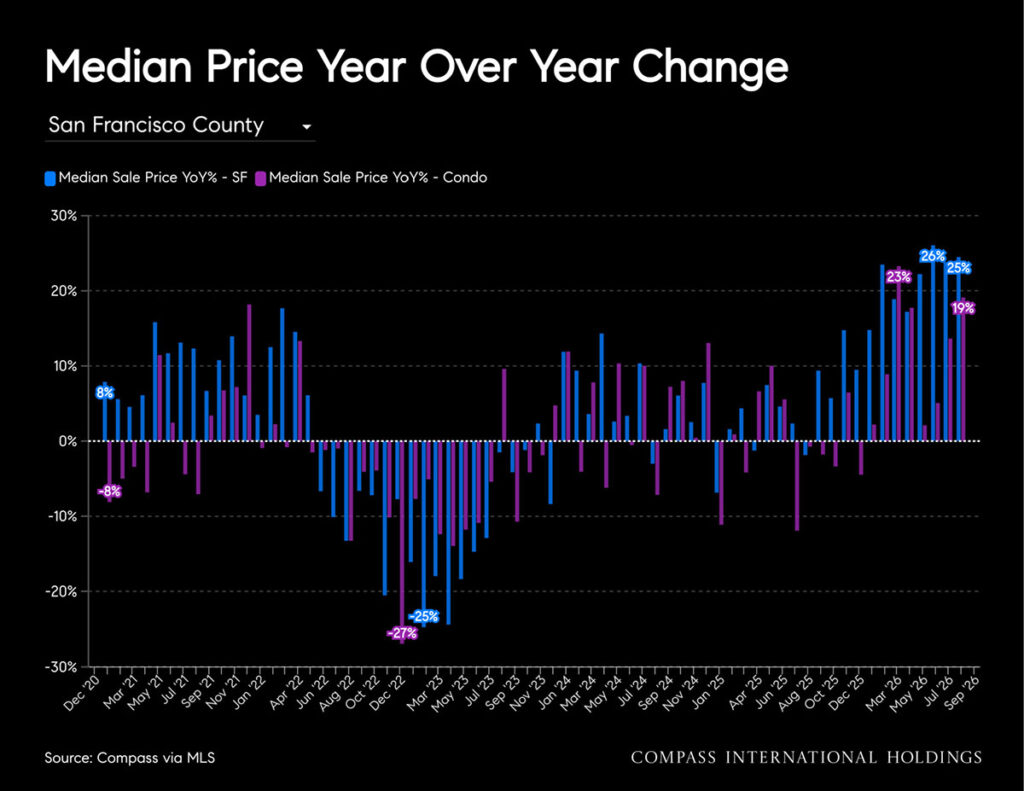
Median Price Year Over Year Change
Single-family median increased 25% YoY, while the condo median rose 19%.
SINGLE FAMILY HOMES
Closed Sales
Median Sales Price
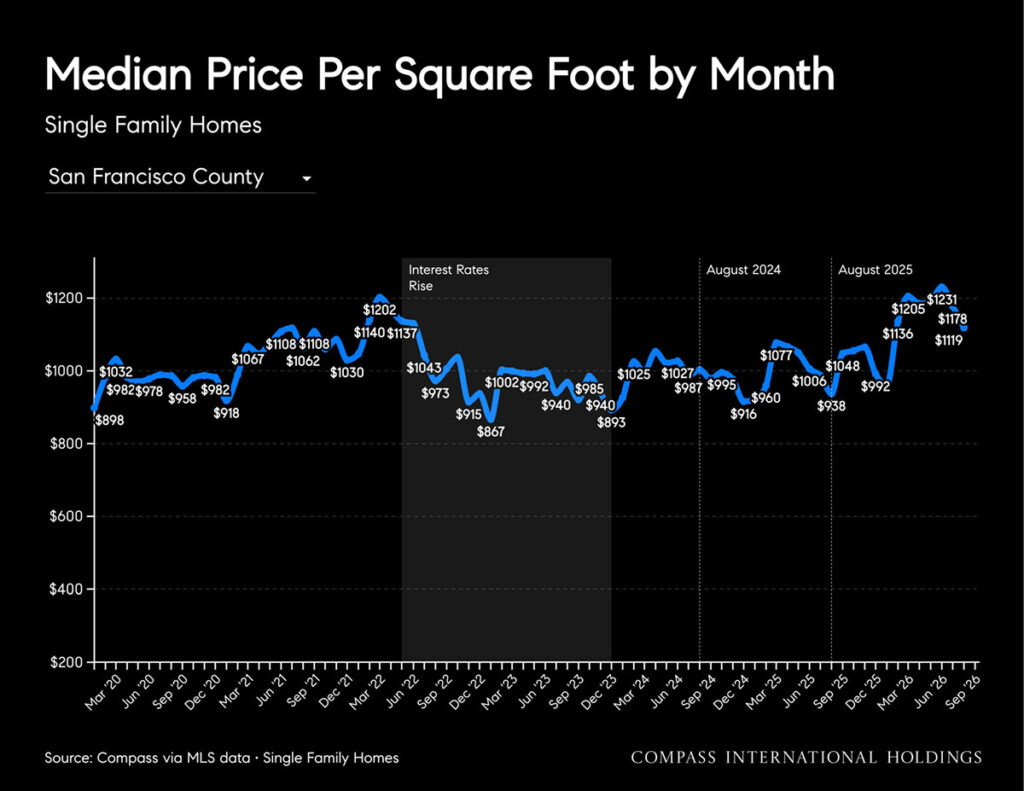
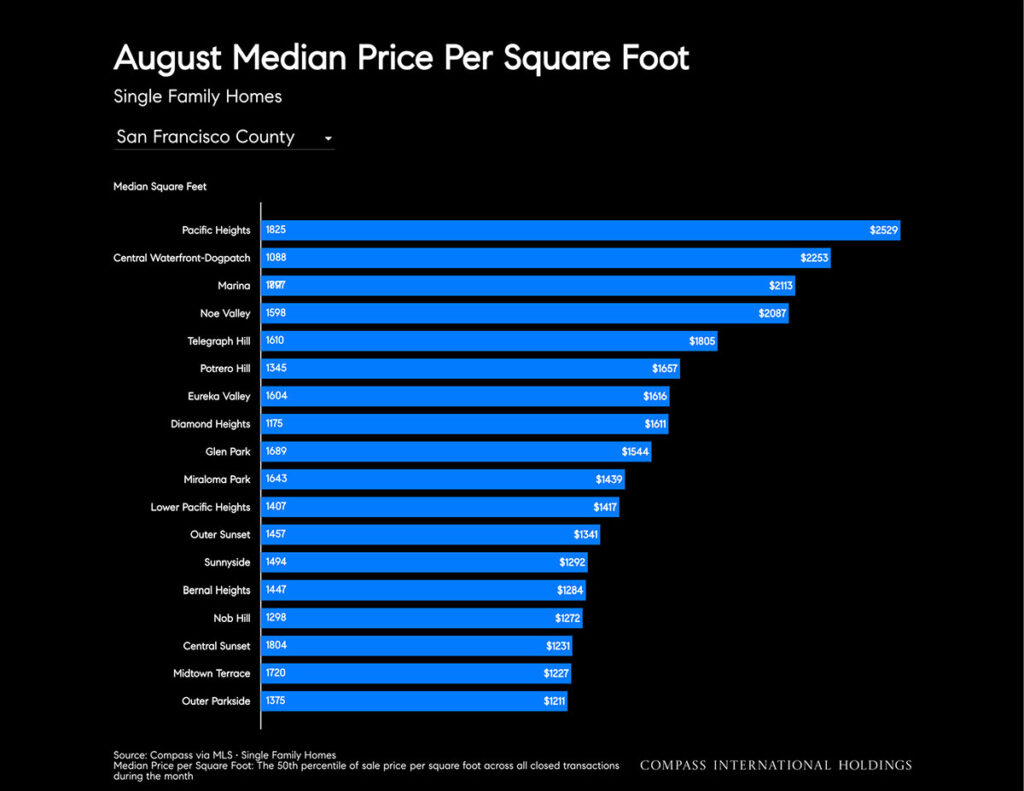
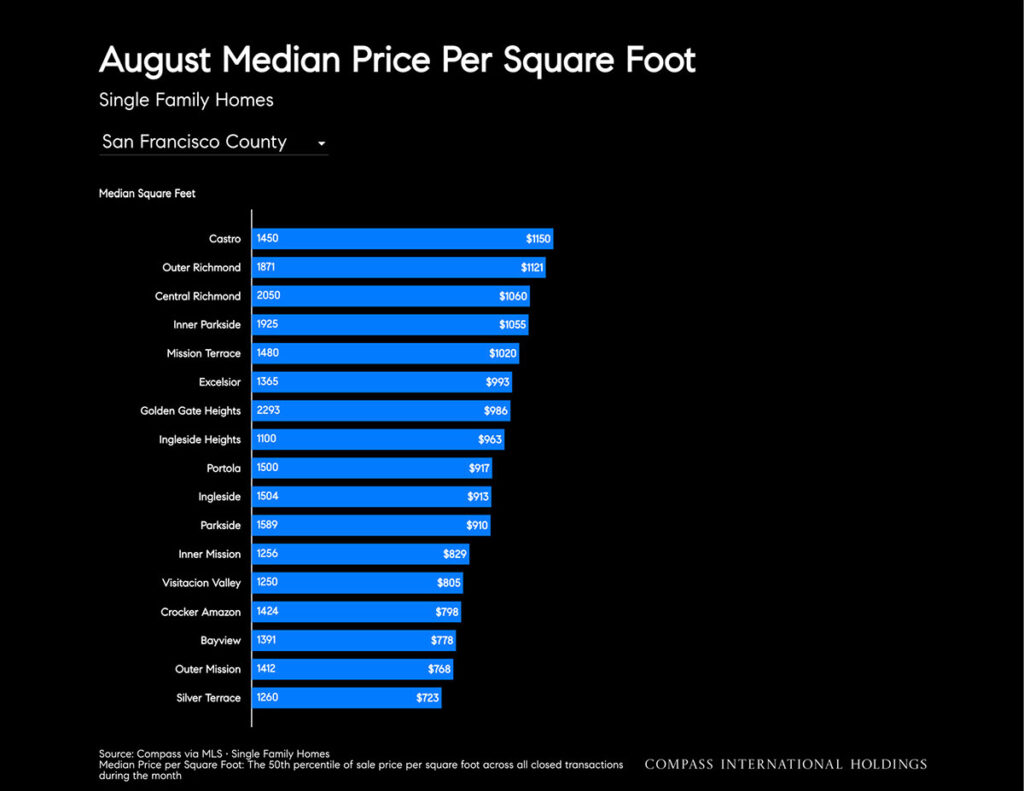
Price per Square Foot
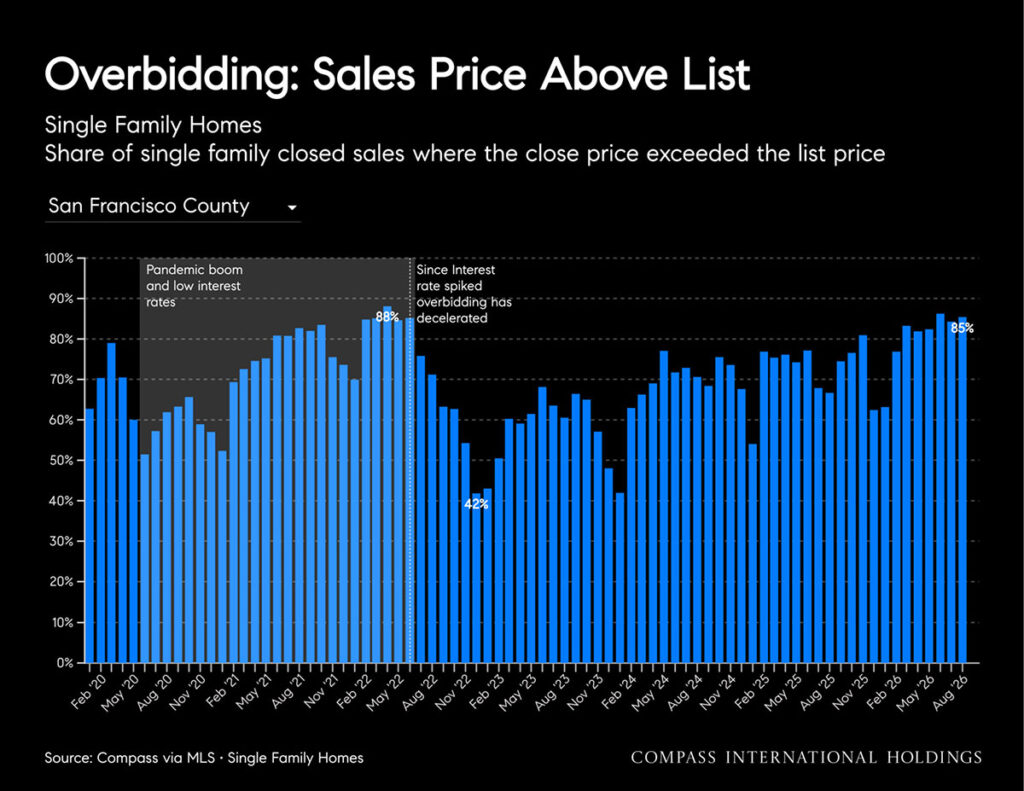
Sale to List Price Ratio
Average Days on Market
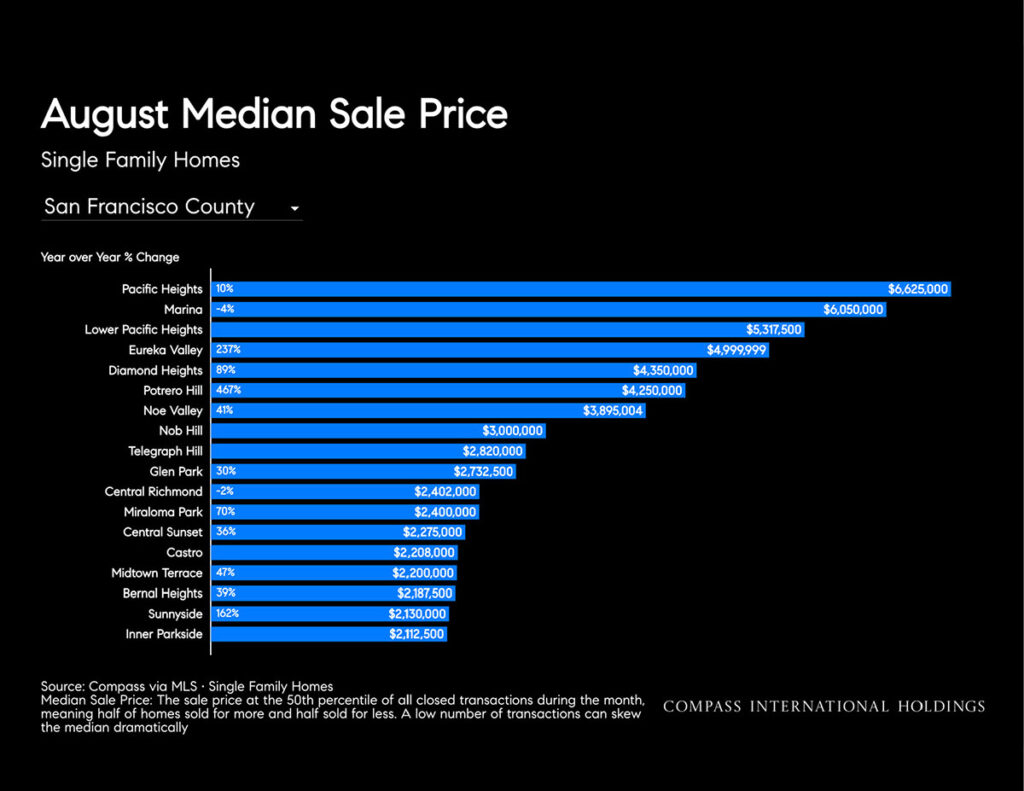
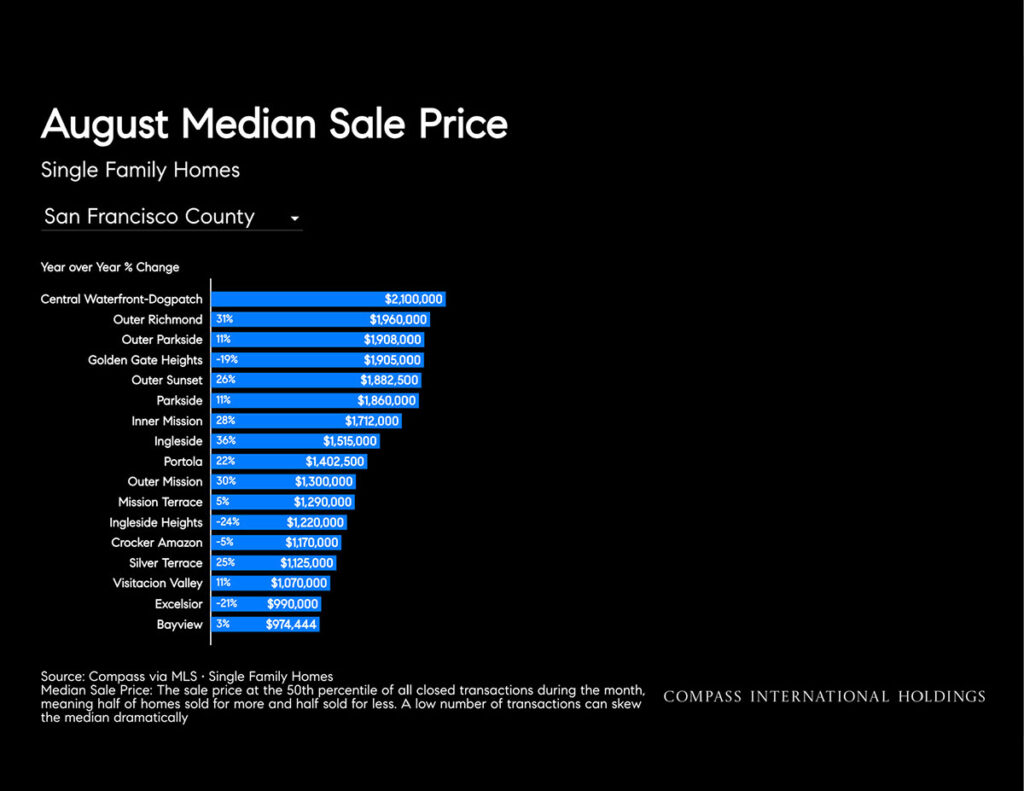
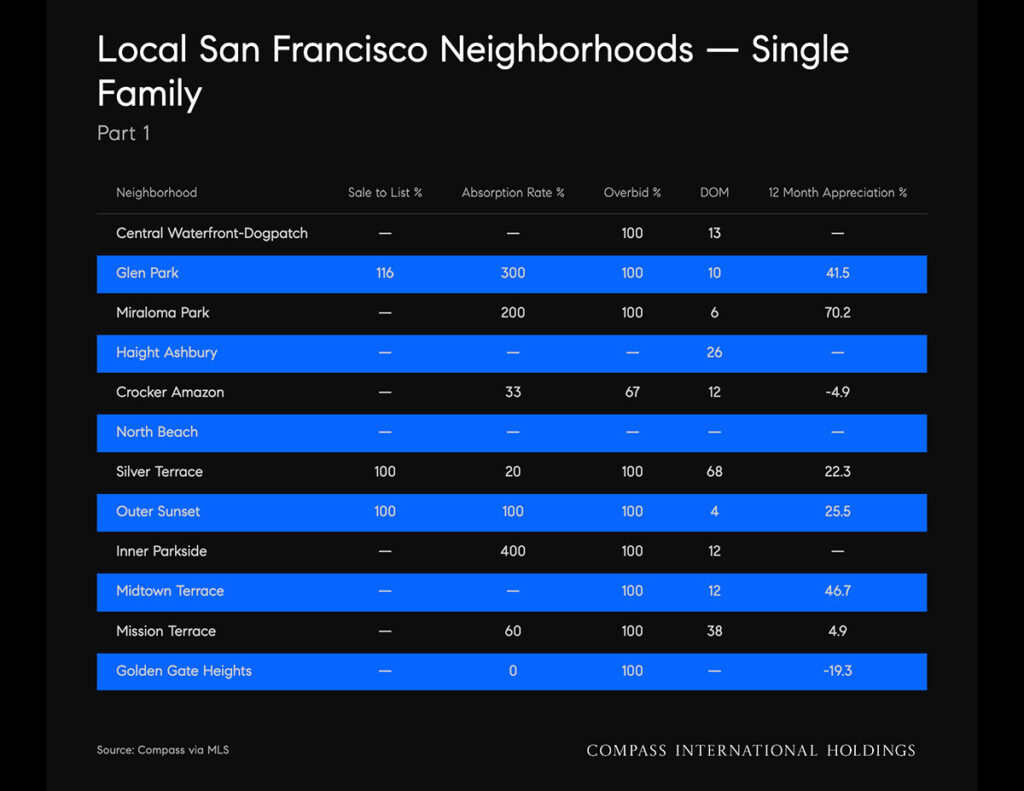
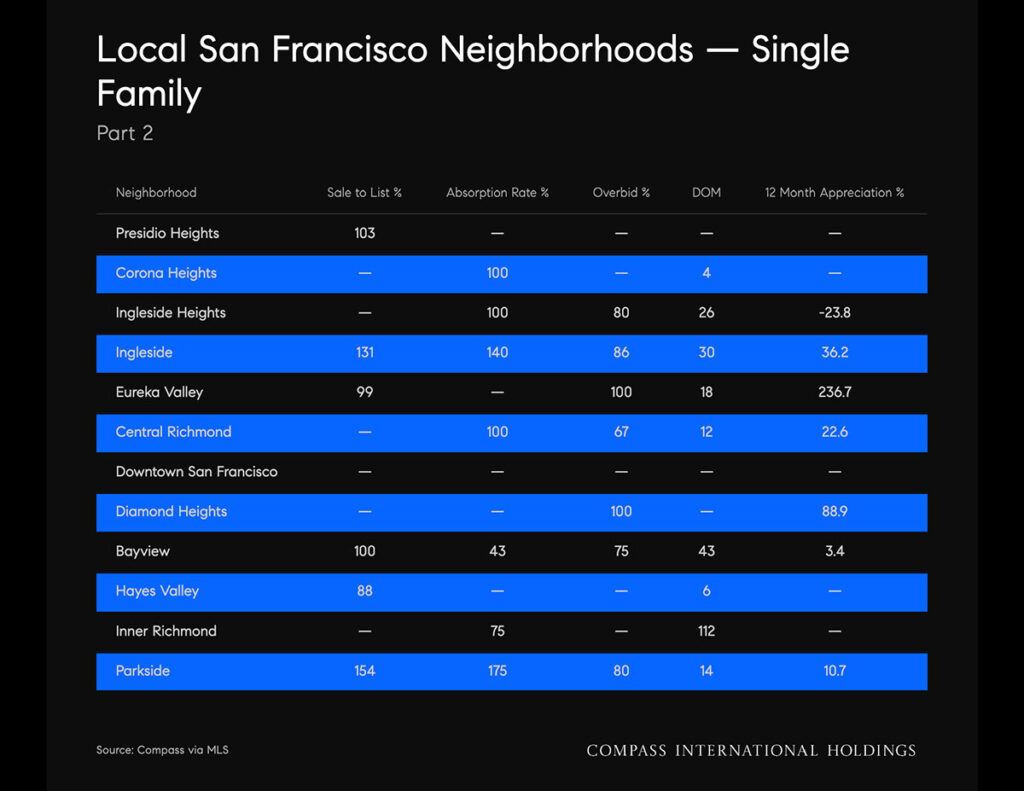
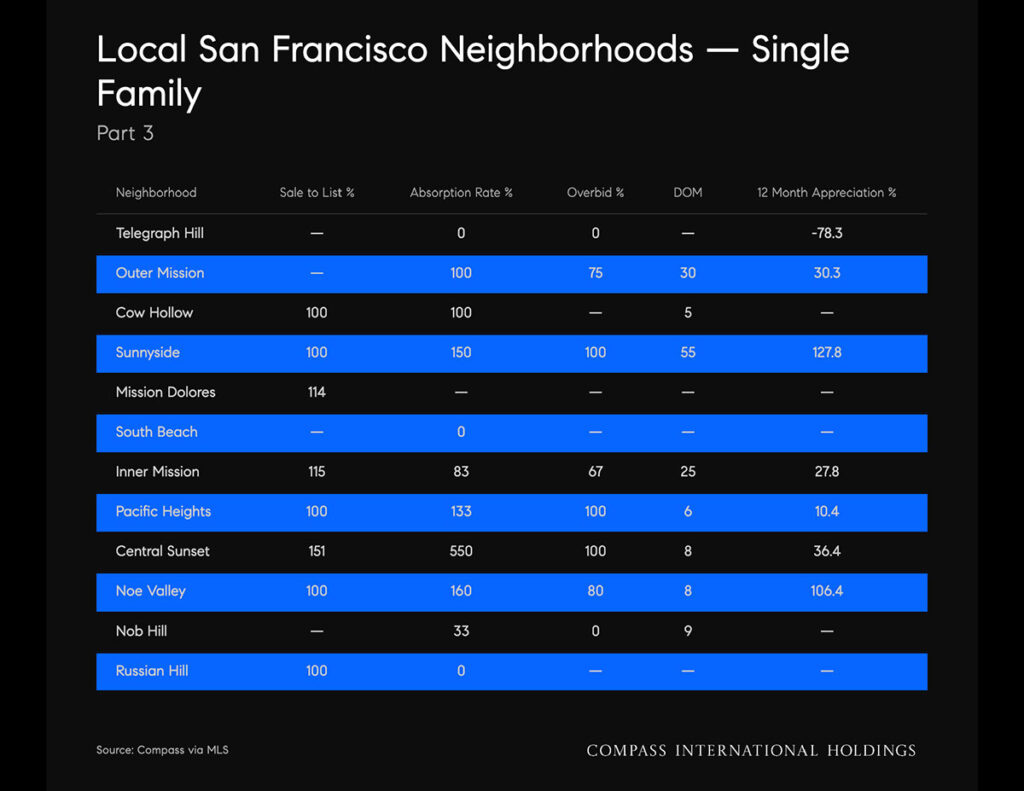
Sales by Select Neighborhoods
CONDOS
Closed Sales
Median Price per Square Foot
Median Sale Price
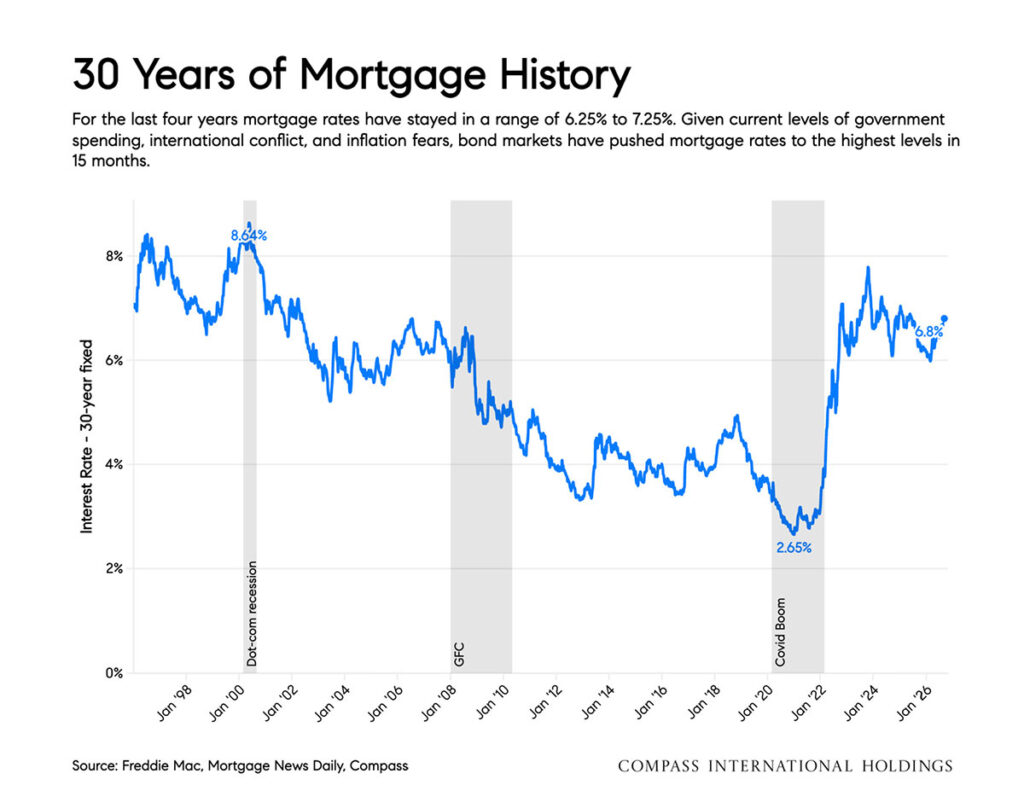
Mortgage Rates
The average 30-year fixed-rate mortgage rose five basis points on September 14 to 7.17%, according to Mortgage News Daily, putting the rate at the highest level since January 2025, when it averaged 7.26%.
The information herein is based on or derived from information generally available to the public and/or from sources believed to be reliable. No representation or warranty can be given with respect to the accuracy or completeness of the information.