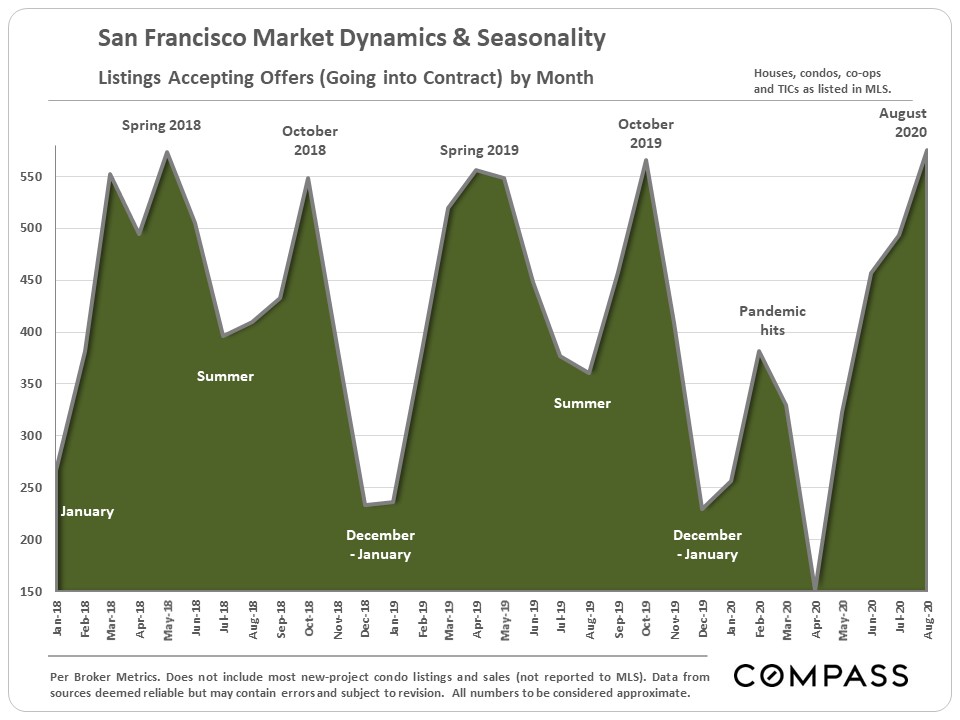
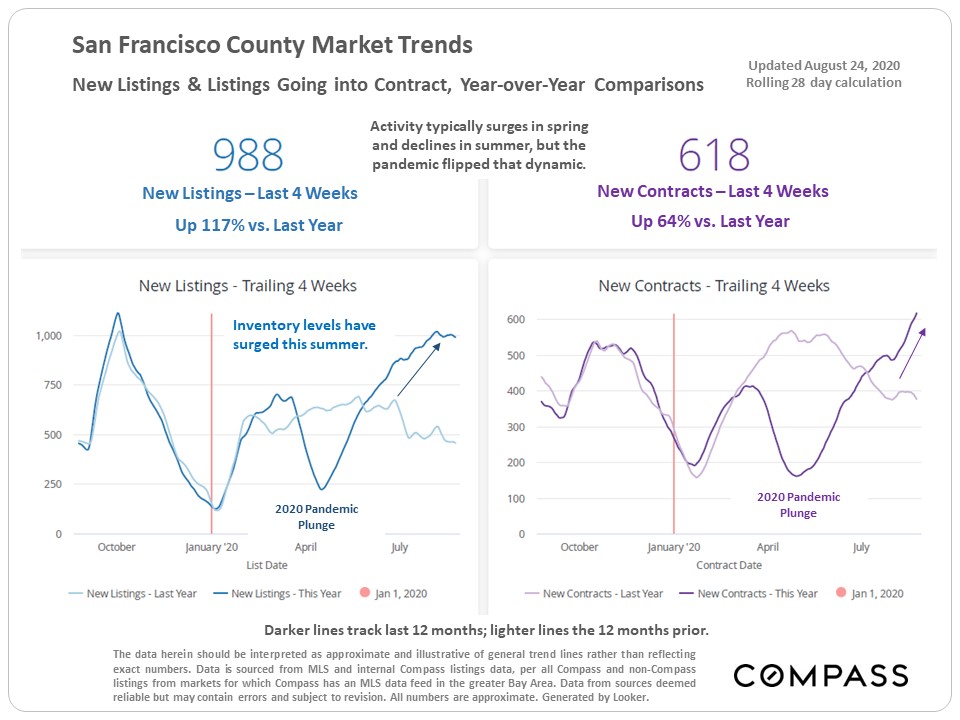
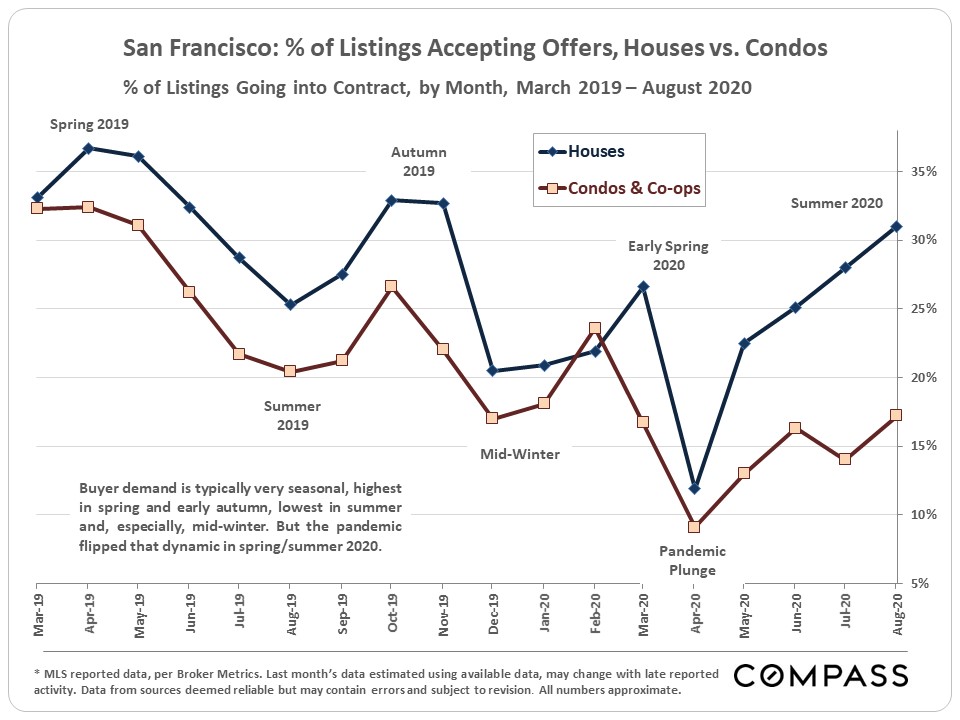
The summer market is coming to an end, but reached a high point this past month. August was a very active month for new listings and for listings going into contract. Active listings in August were up 45% compared to last year and listings going into contract were up 64% compared to last year; while this is partly due to the fact that the typical August market is fairly slow, it’s a positive indicator after this year’s Spring slump.
In August, listings accepting offers peaked for the year, matching the high points of recent years (which were in the Spring and October). As we head into the typically busy Fall market, this upward trend may continue.
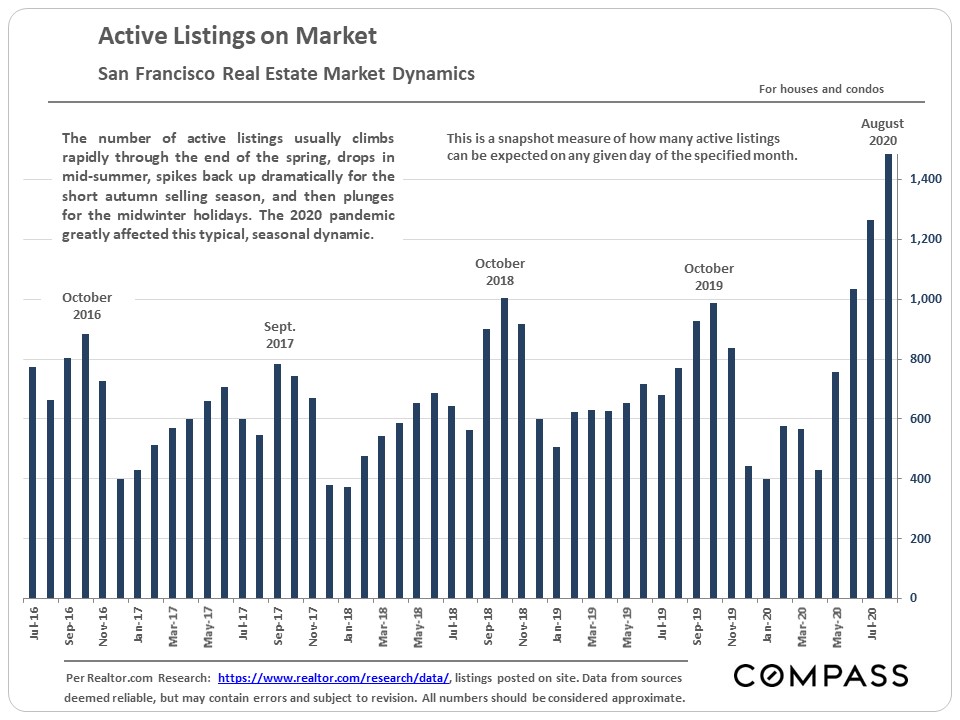
Active Listings Increase
The number of active listings on the San Francisco market rose dramatically over the last few months, outpacing the increase in listings going into contract. However, there are significant differences between the house and condo markets, which are discussed more later in the report.
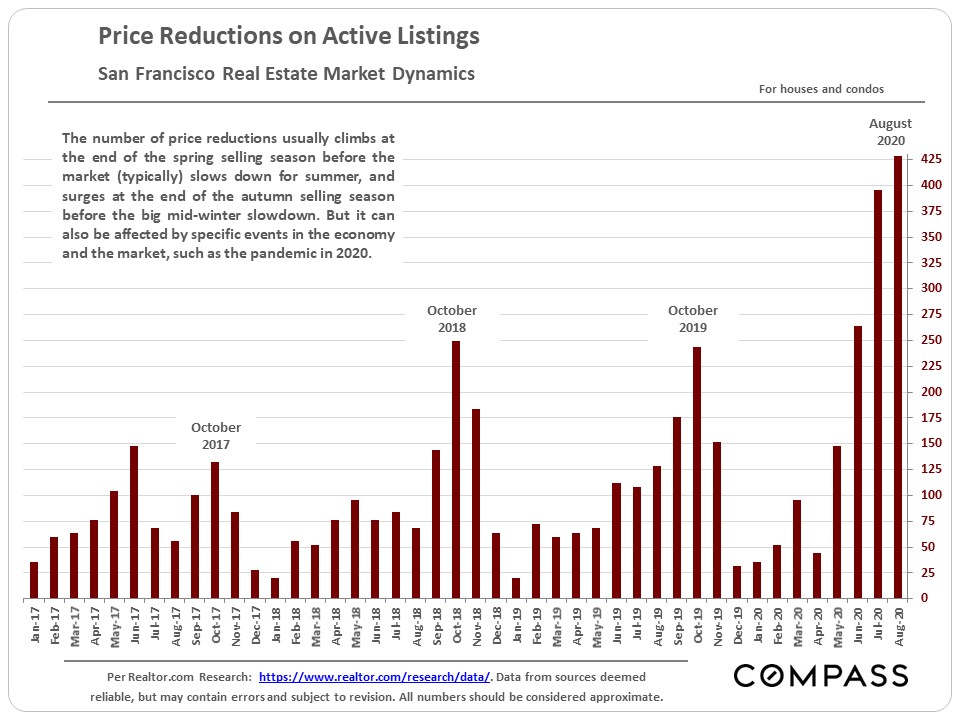
Price Reductions on Listings
With the increase in inventory we’ve seen an increase in the number of listings reducing the asking price. In some market segments, sellers are now competing for buyers, instead of buyers competing for properties.
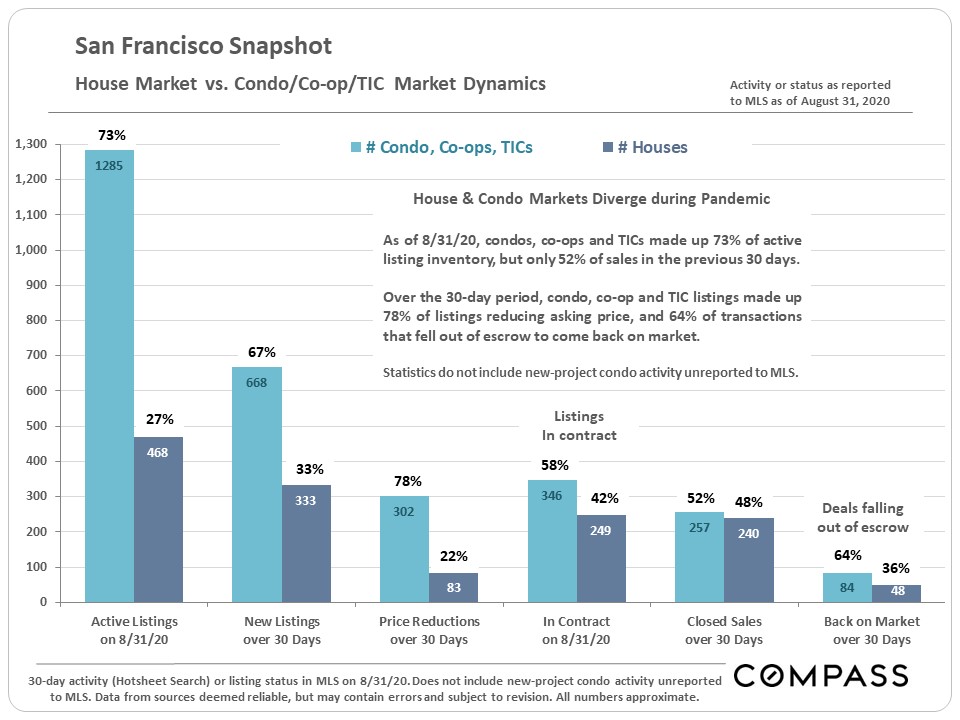
House vs. Condo Market
The next two charts illustrate how the house and condo markets have diverged since the pandemic hit. Comparing demand to supply, the condo market is much weaker than the market for houses. However, within the condo market, different neighborhoods are seeing varying dynamics, and hundreds of condos are still selling each month.
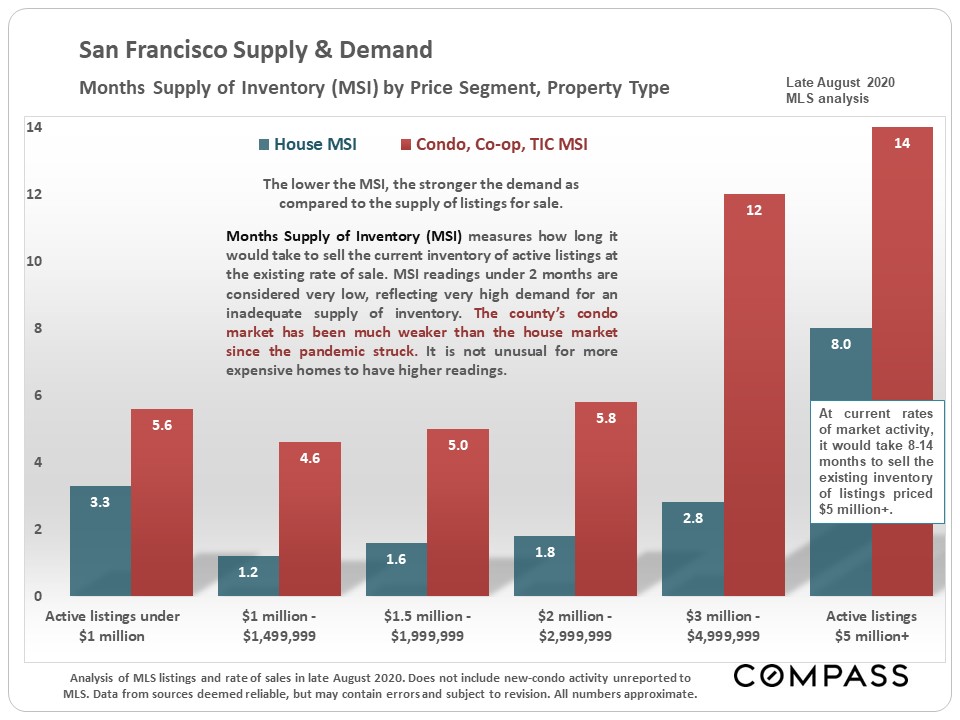
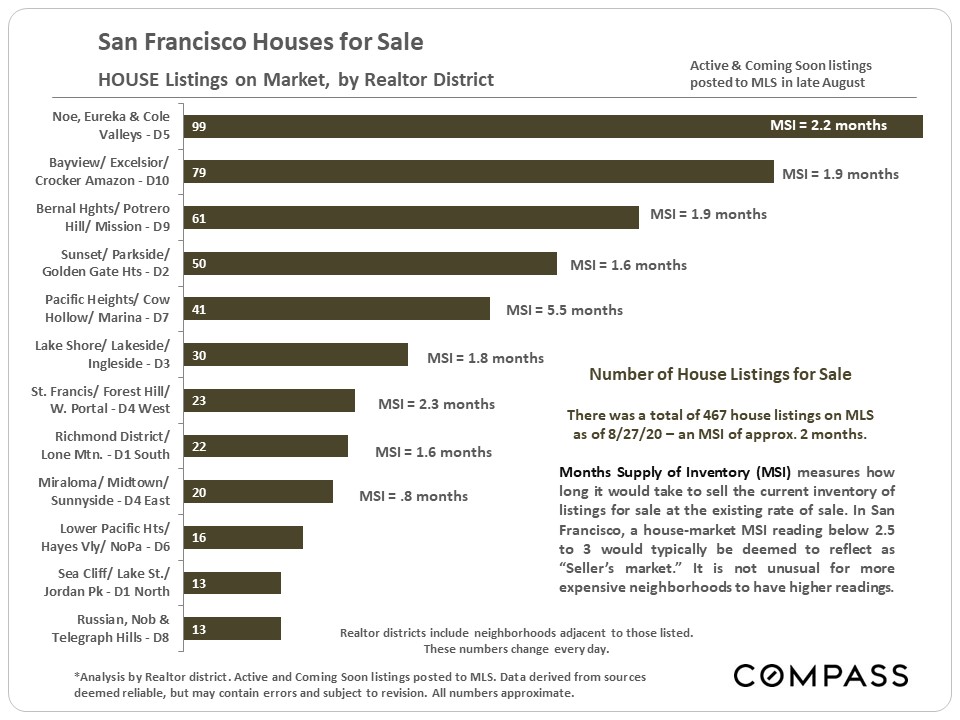
In the chart below, the lower the Months Supply of Inventory (MSI), the stronger the demand as compared to the supply of listings for sale. Much of the San Francisco house market (the blue columns) remains firmly in “seller’s market” territory, but the condo market’s supply (the red columns) is outpacing buyer demand, especially in the higher price segments.
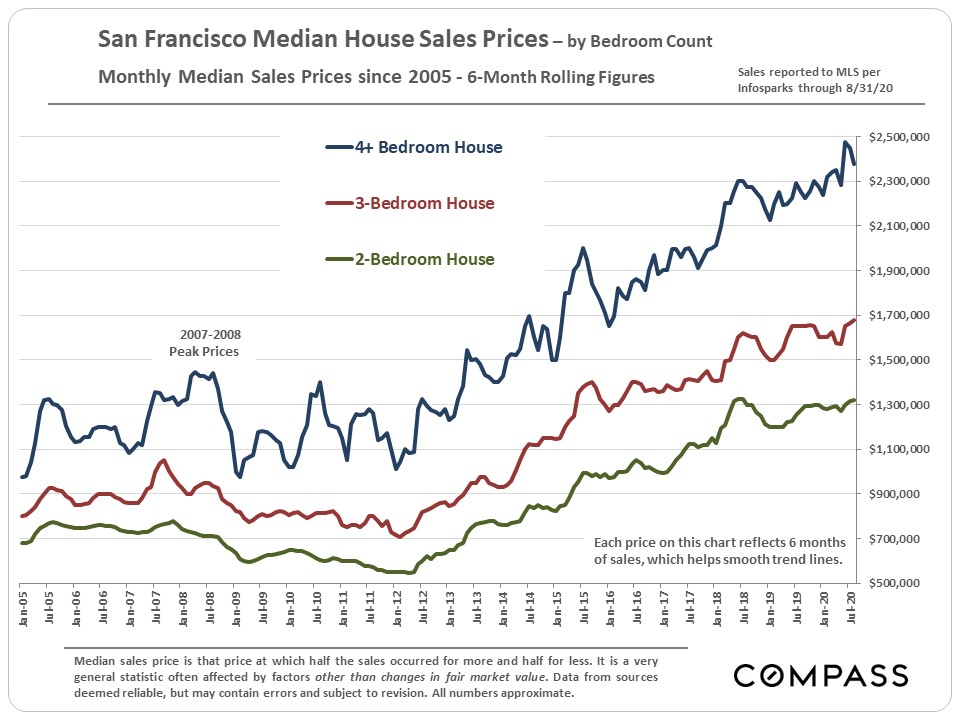
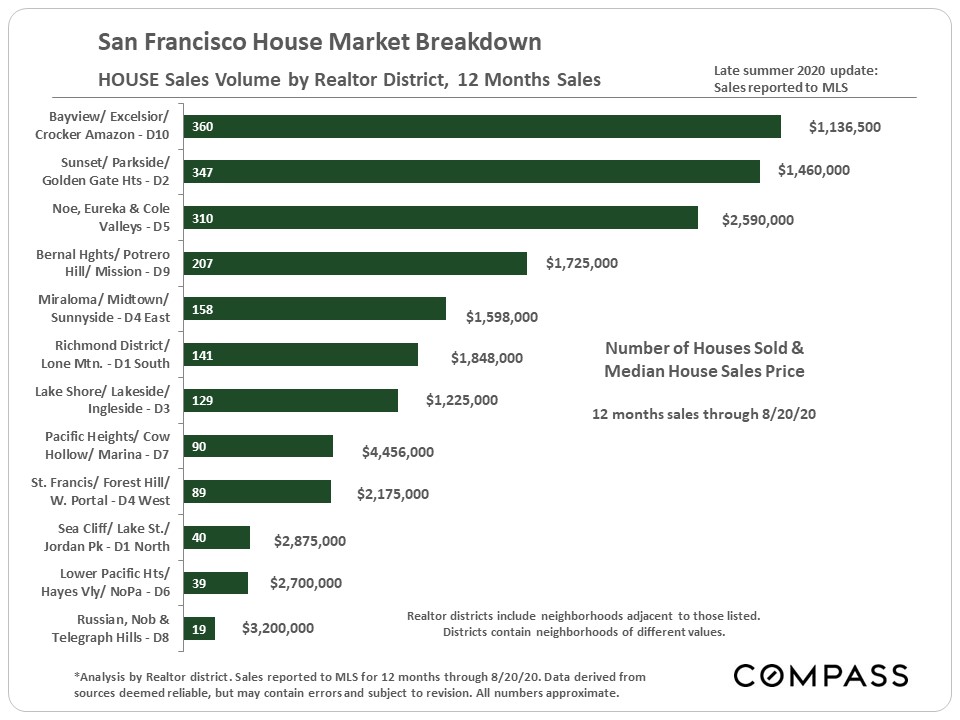
House Market Trends
The next three charts show median house sales price trends by bedroom count; sales volumes and median sales prices by Realtor district; and the number of active house listings by Realtor district with an analysis of months supply of inventory.
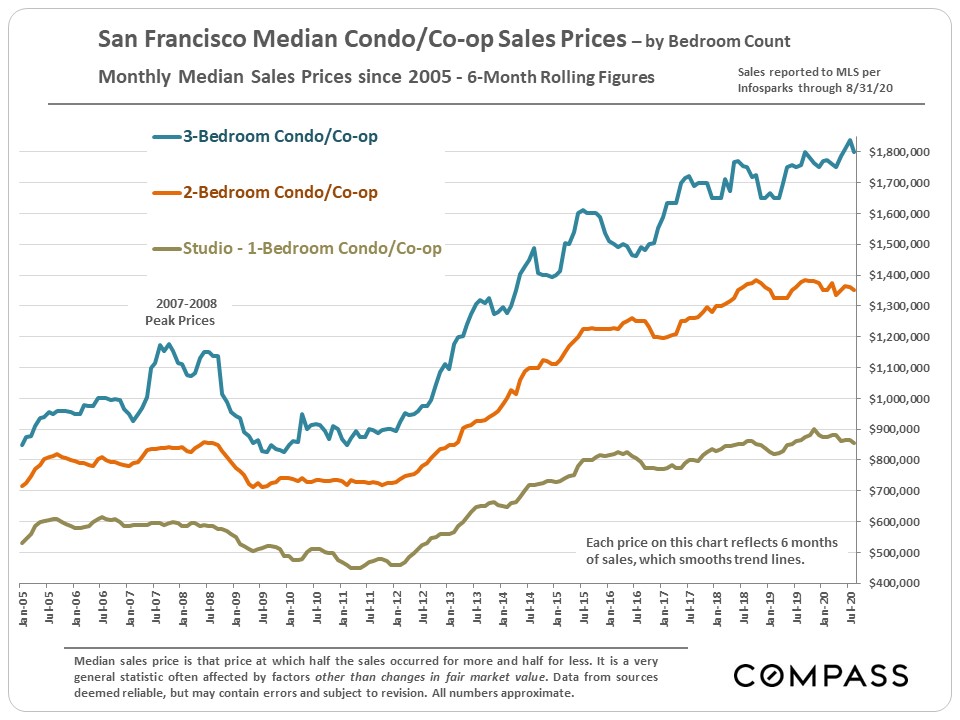
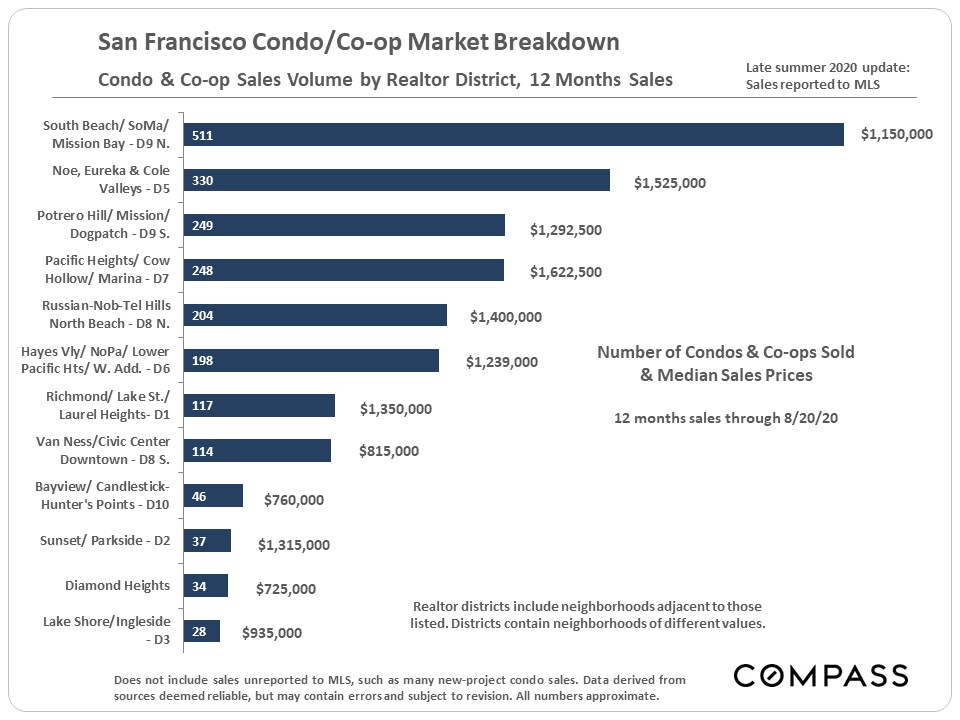
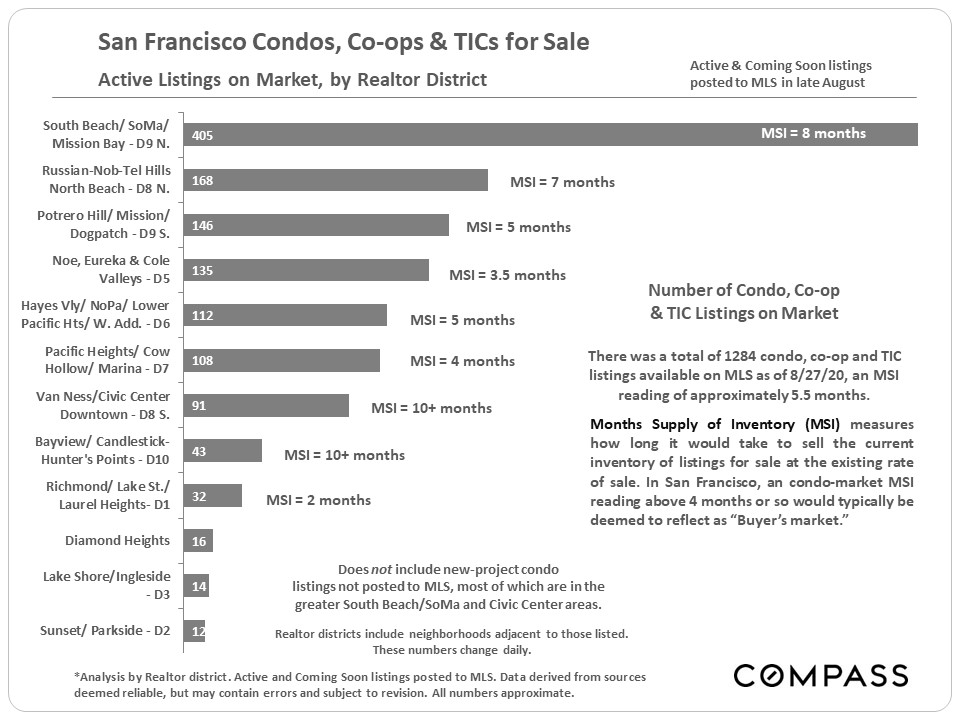
Condo Market Trends
The following three charts illustrate market trends for condos, including median sales price trends by bedroom count; sales volumes and median sales prices by Realtor district; and the number of active listings by Realtor district with an analysis of months supply of inventory.
The information herein is based on or derived from information generally available to the public and/or from sources believed to be reliable. No representation or warranty can be given with respect to the accuracy or completeness of the information.