It’s been a bit of a roller coaster for all economic indicators as the world grapples with the coronavirus pandemic.
These charts look at the effect of the crisis on supply and demand by reviewing week by week statistics, sales price trends reflecting the market before the crisis, and longer-term trend data to give context to how the market typically performs at this time of year. It’s important to note that there is typically a three to six week time lag between a new listing coming on market, an offer being negotiated and accepted, and when the transaction actually closes sale. This means that almost all of the sales price data we have, as of the first week of April, still reflect the market BEFORE the shelter-in-place rules went into effect.
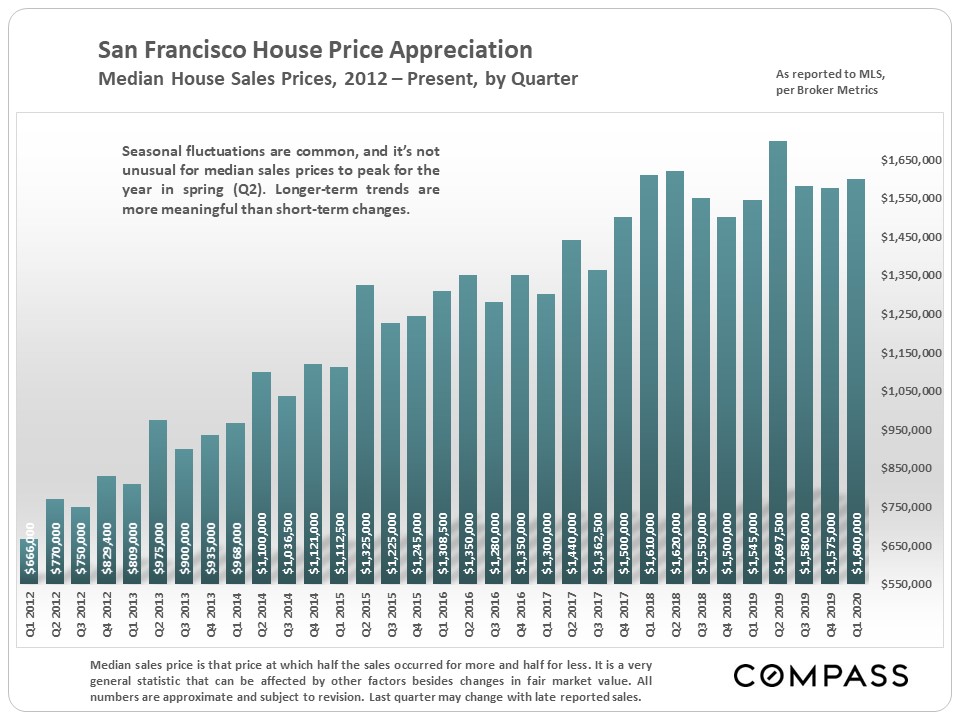
Spring is usually the most active selling season and often sees the highest median sales prices of the calendar year. In virtually all Bay Area counties, first quarter and March median sales prices were quite strong, as is expected for this time of year.
We do not know how the crisis will ultimately play out, depending as it does on so many, rapidly changing, socio-economic factors. Whatever happens, San Francisco is historically and reliably a strong market for real estate.
House and Condo Sales Prices through March
The following charts provide an overview of San Francisco house and condo sales prices reported through mid-March of this year. The charts show a slight increase in sales prices for both homes and condos, consistent with previous years.
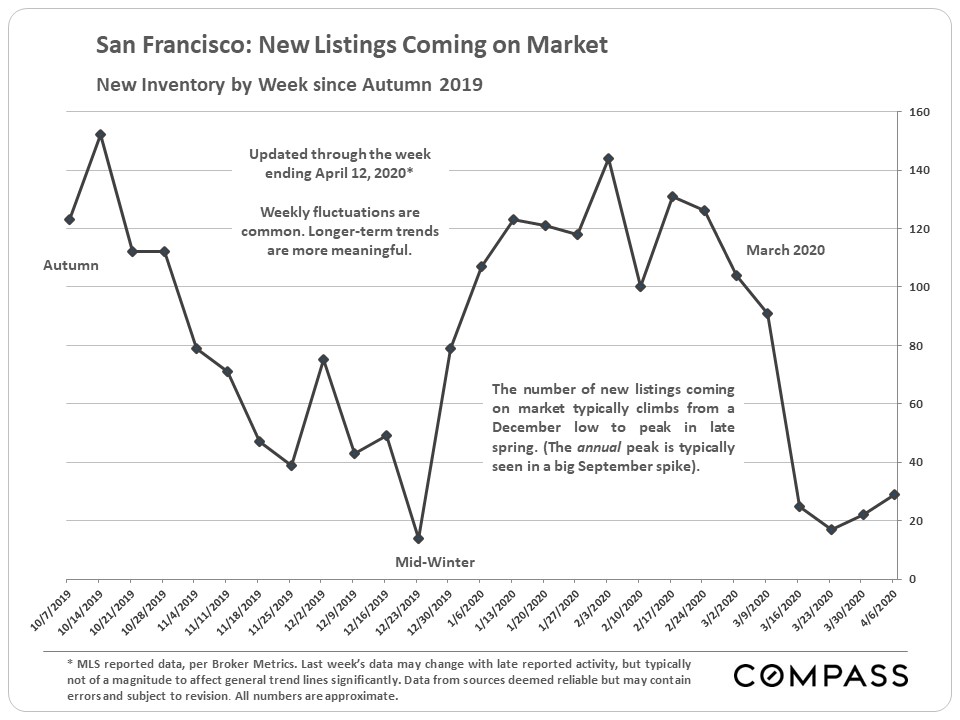
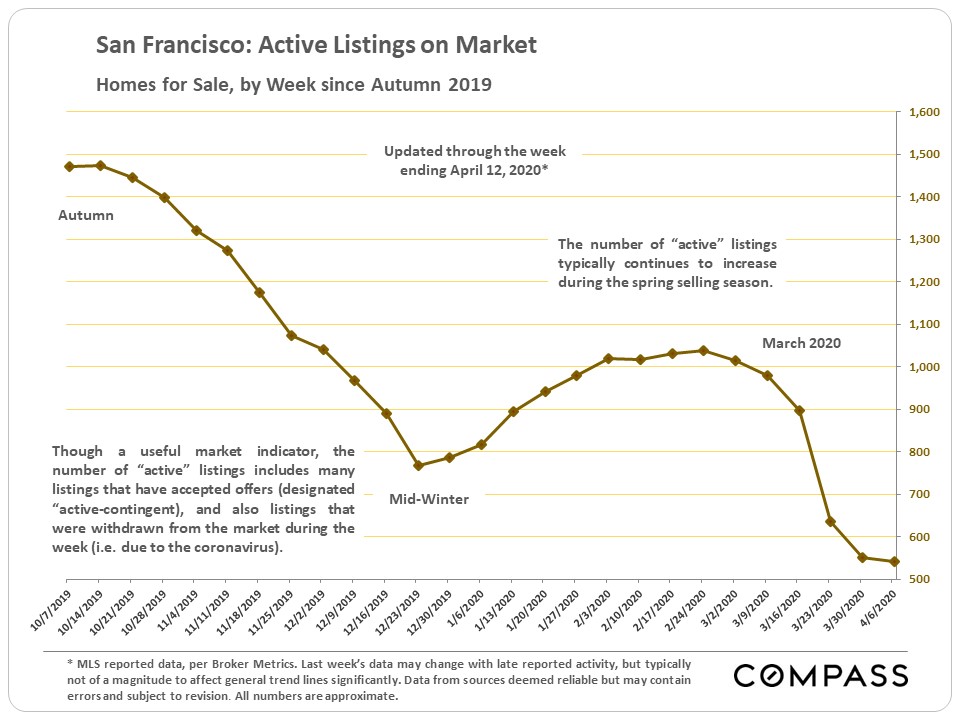
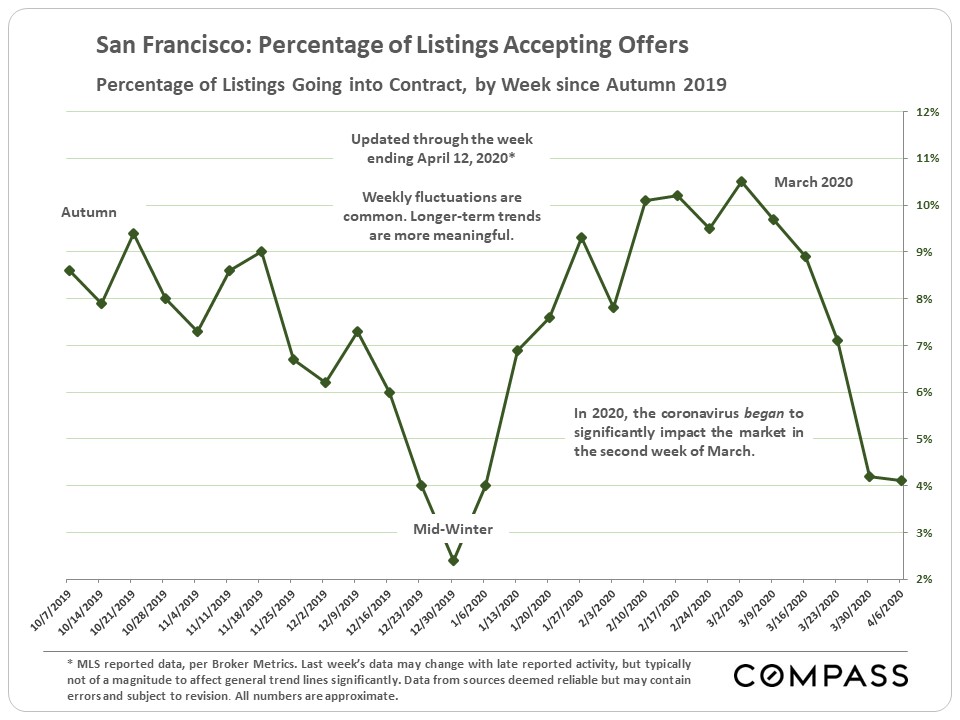
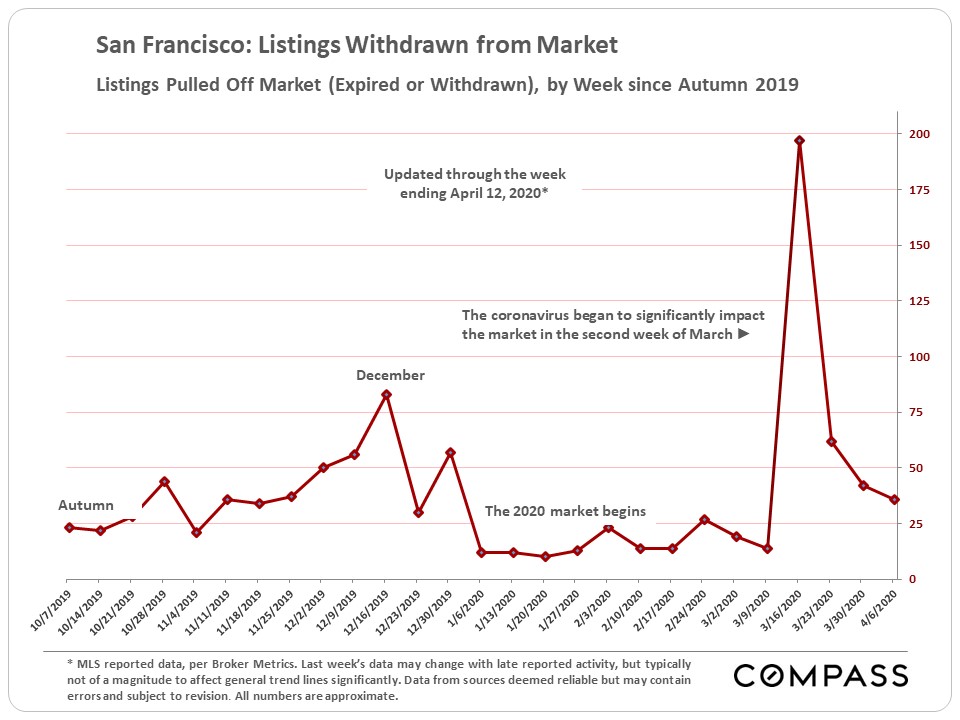
Shelter-In-Place Impact on Listing Activity
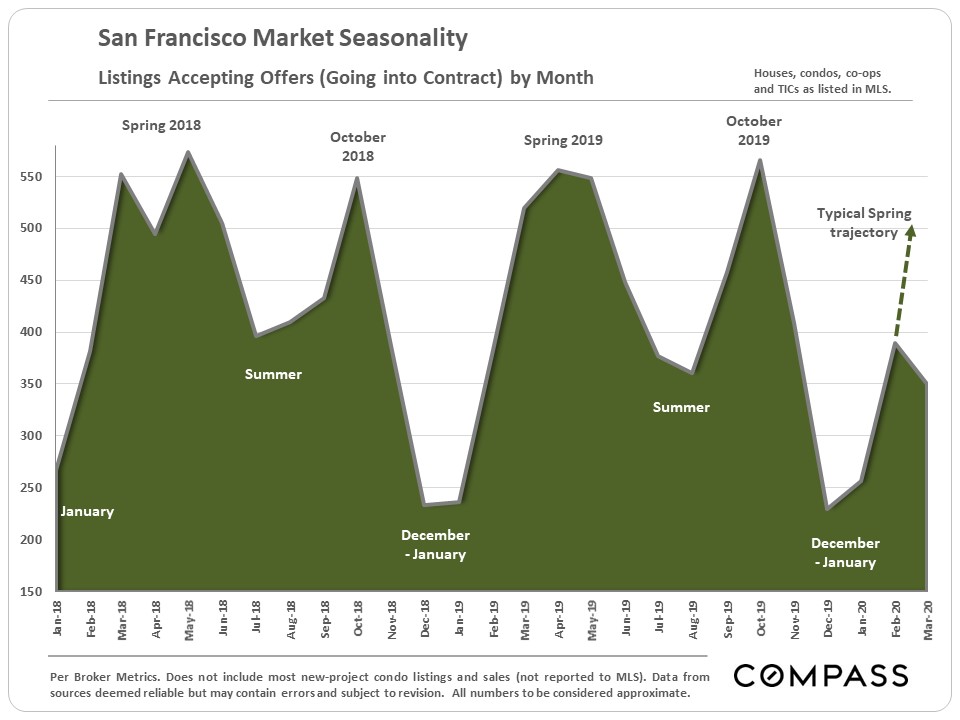
The following four charts detail the plunge in listing and accepted-offer activity, and the surge in listings being pulled off the market by sellers, over the past four weeks. Typically, at this time of year, the first three charts would be seeing steady climbs over February numbers, and the fourth chart would have a very low, flat trend line.
Though the numbers are way down, some listings have still been going into contract.
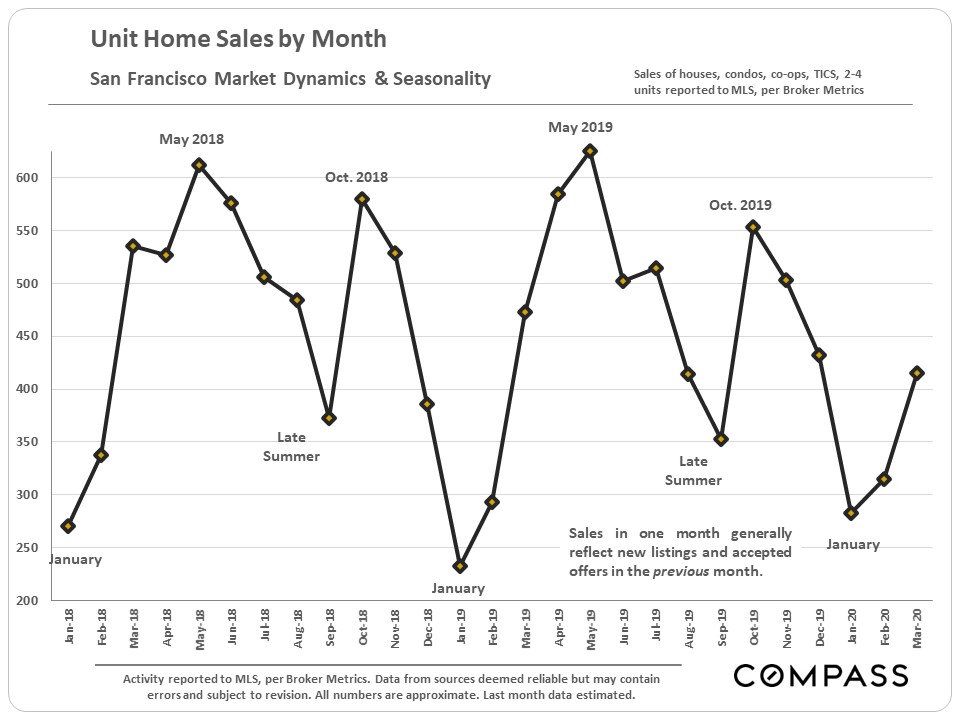
Market Dynamics & Seasonality
We can see in this charts below how the March 2020 sales compare to March sales in the previous two years. Given that the sales in a month reflect the previous month’s actual activity, we anticipate seeing these numbers decline further in the coming months.
The information herein is based on or derived from information generally available to the public and/or from sources believed to be reliable. No representation or warranty can be given with respect to the accuracy or completeness of the information