Though the pandemic upended many normal seasonal trends this year, the market did begin its typical “holiday season” slowdown in November. In spite of this normal slowdown, market activity remained well above last year’s levels. As we head into the slowest part of the year, and with new lockdown measures, the December numbers will soon show if market activity is again above previous years.
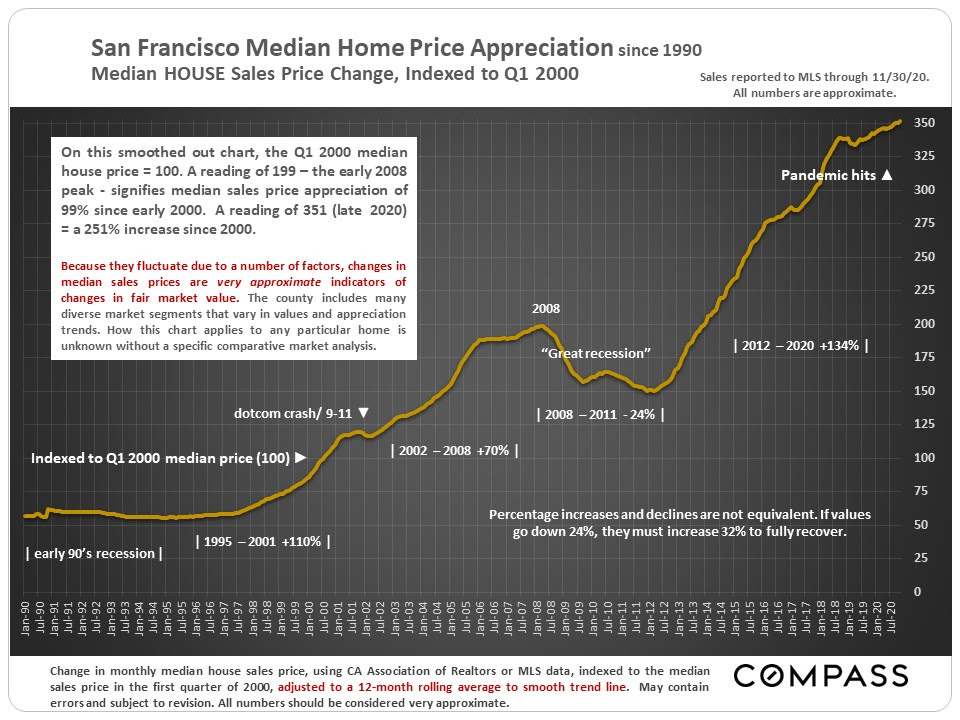
Median House Price Appreciation
This chart tracks percentage changes in median house sales price since 1990. It is based upon the Q1 2000 price being indexed to 100: A reading of 50 signifies a median price half that in Q1 2000; 200 means the price has doubled since then. In early 1990, the SF median house price was about $300,000; it is currently running about $1,650,000.
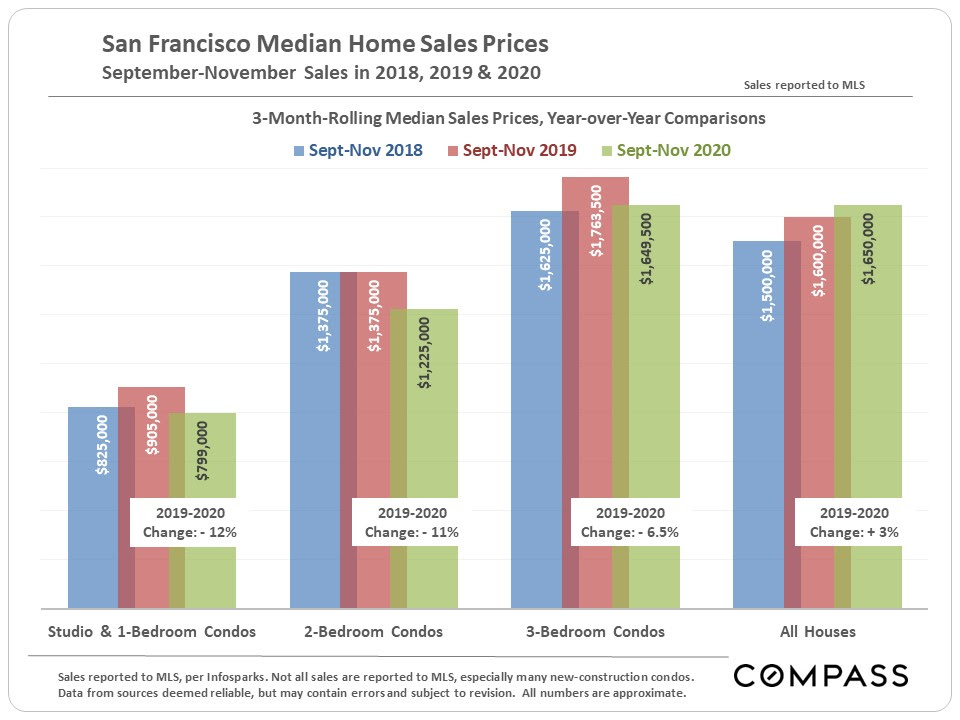
Median Sales Prices - September to November 2018-2020
The chart below shows year-over-year median sales prices for condos of various sizes, and for houses, between the months of September through November in 2018, 2019 and 2020. Since the pandemic, the big increase in supply of condos has led to declines in condo median sales prices.
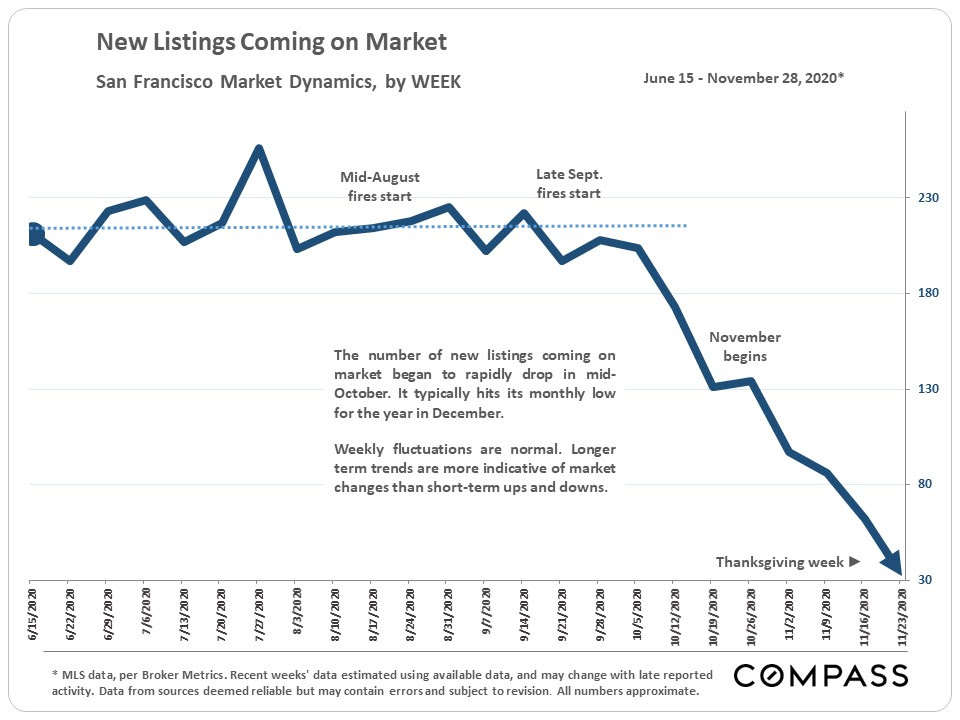
New Listings
As is typical, the number of new listings decreased in November, which is typically a quiet month for the real estate market. In the first week of December (not illustrated on this chart) new listing activity ticked back up from the short Thanksgiving week, but remained well below pre-November numbers. December is usually the month with the lowest number of new listings coming on market.
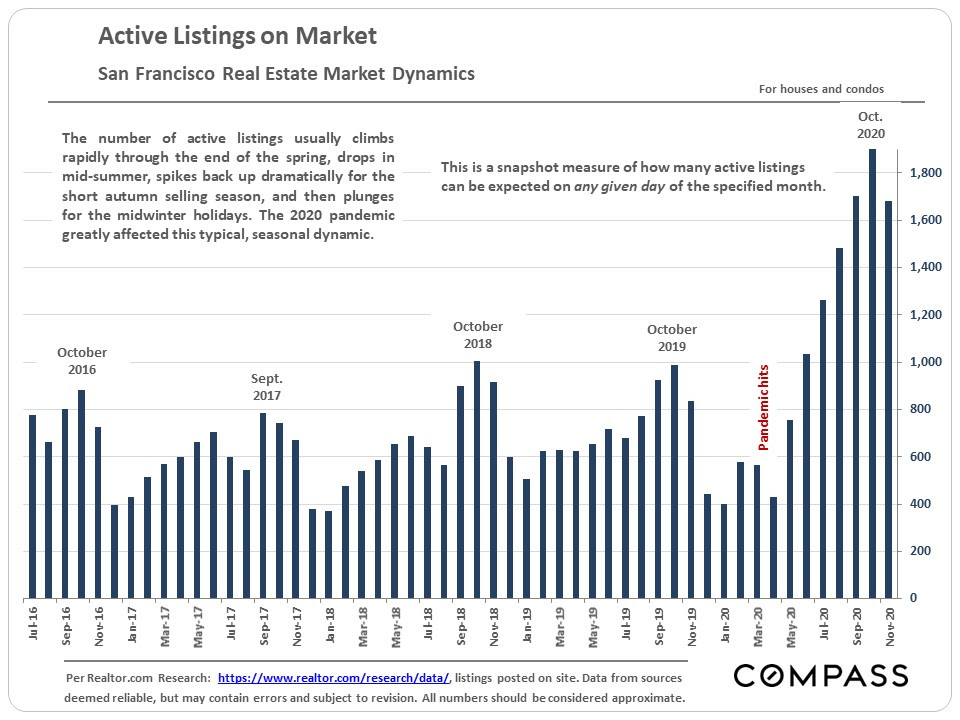
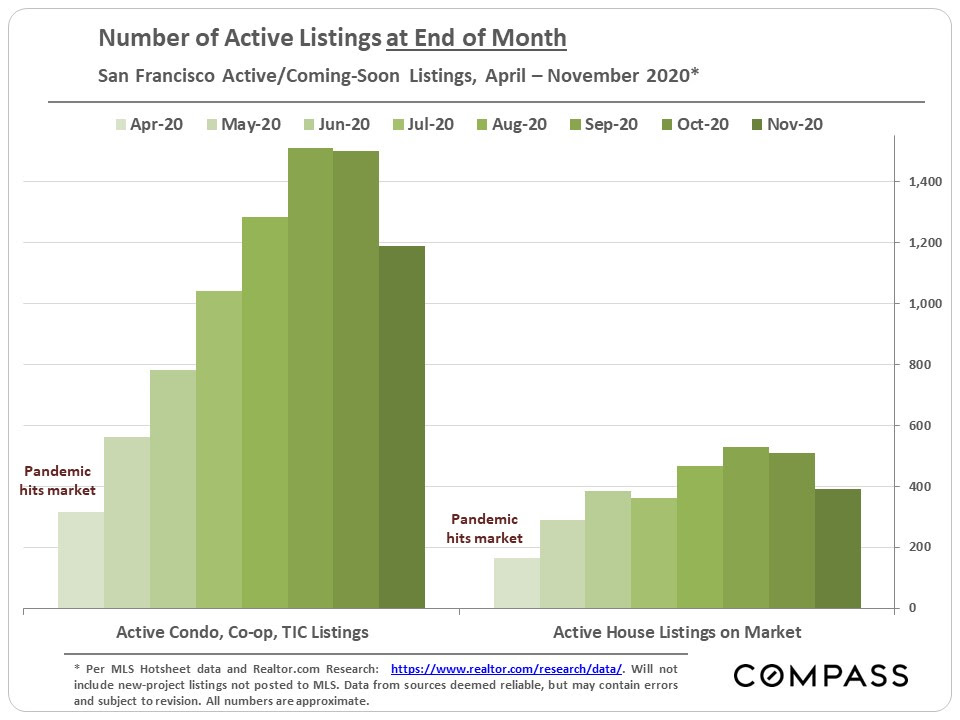
Active Listings
With the decline in new listings, overall listing inventory dropped, but remained much higher than in previous years.
The number of condos on the market dramatically increased since the pandemic struck, but began to decline in November.
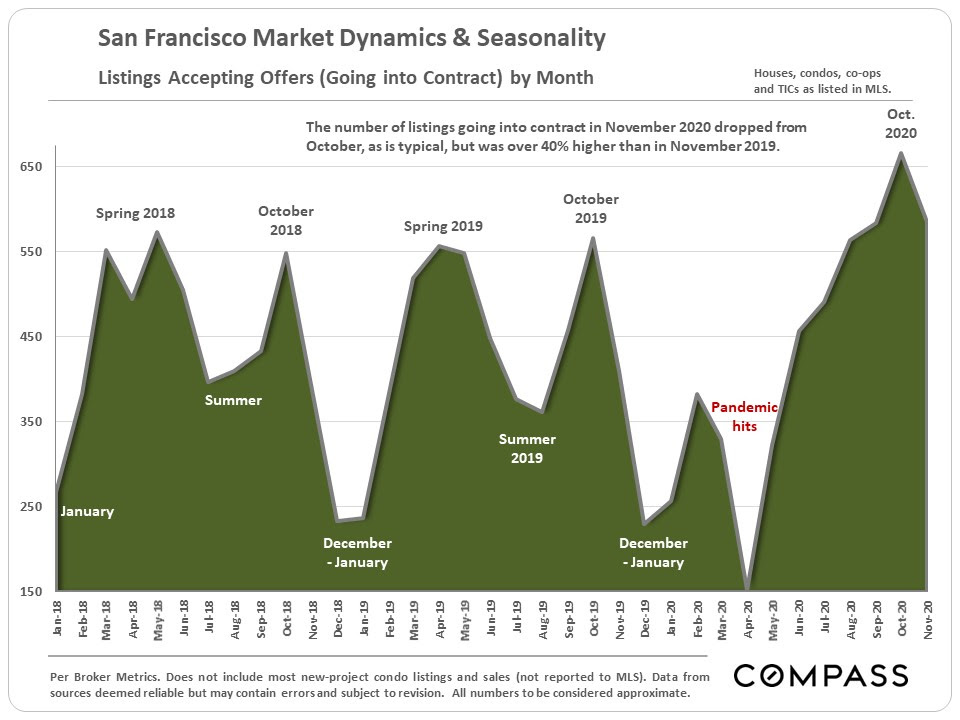
Market Dynamics & Seasonality
Reflecting the atypical market this year, the number of listings going into contract is significantly higher on a year-over-year basis. Listings going into contract in November 2020 was over 40% higher than in November 2019.
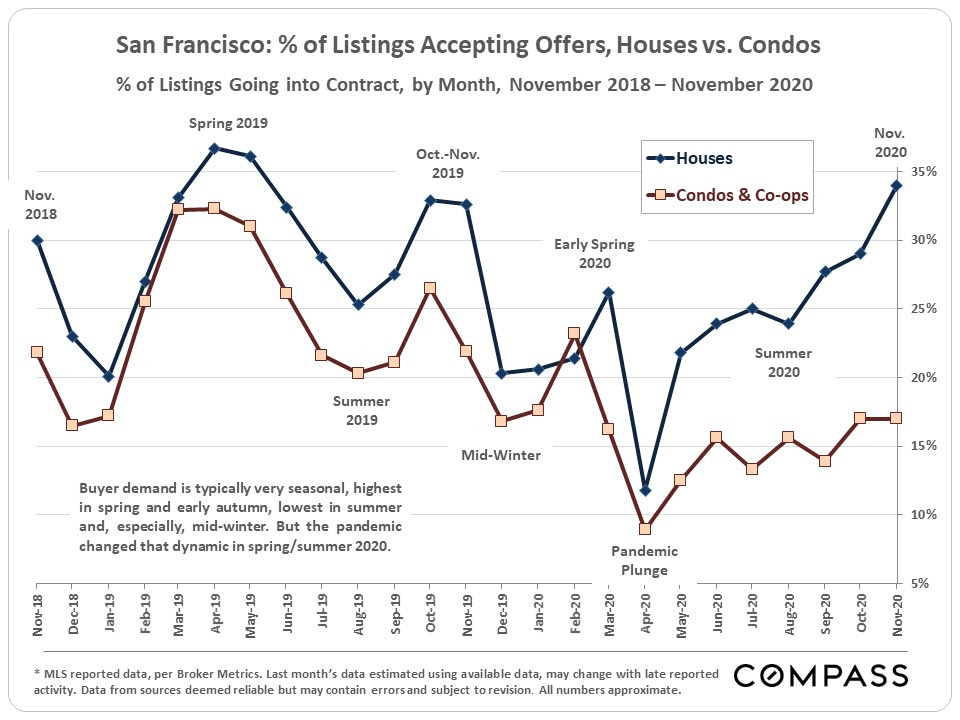
The below chart measures demand as compared to the supply of listings available to buy. By this metric, the house market has been significantly stronger than the market for condos since the pandemic struck.
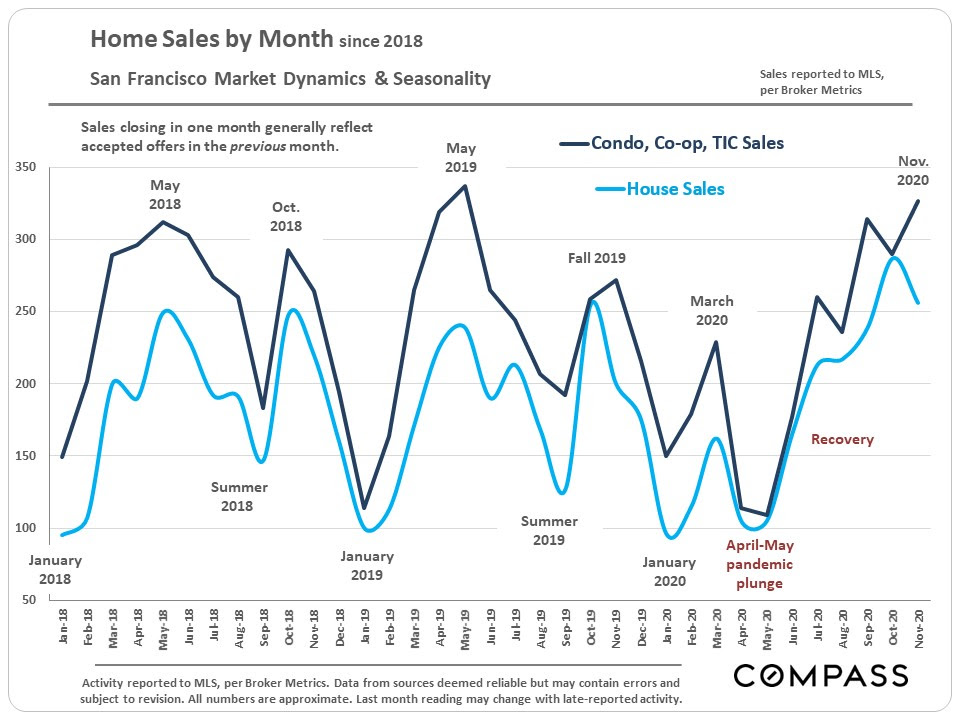
Monthly home sales volume by property type:
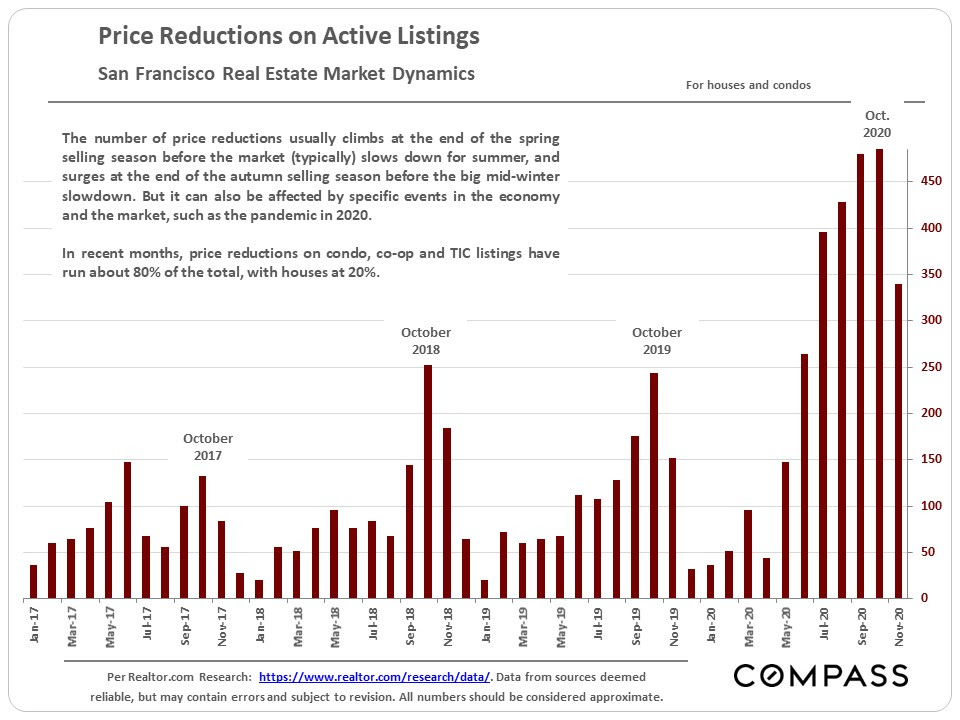
While the number of listings with price reductions dropped in November, the total number is still higher than in previous years.
The information herein is based on or derived from information generally available to the public and/or from sources believed to be reliable. No representation or warranty can be given with respect to the accuracy or completeness of the information.