While market volatility, rising interest rates, and dwindling consumer confidence are on everyone’s minds, real estate market indicators in San Francisco remain strong. Limited inventory is still driving a competitive market for single family homes, and sales for condos have increased.
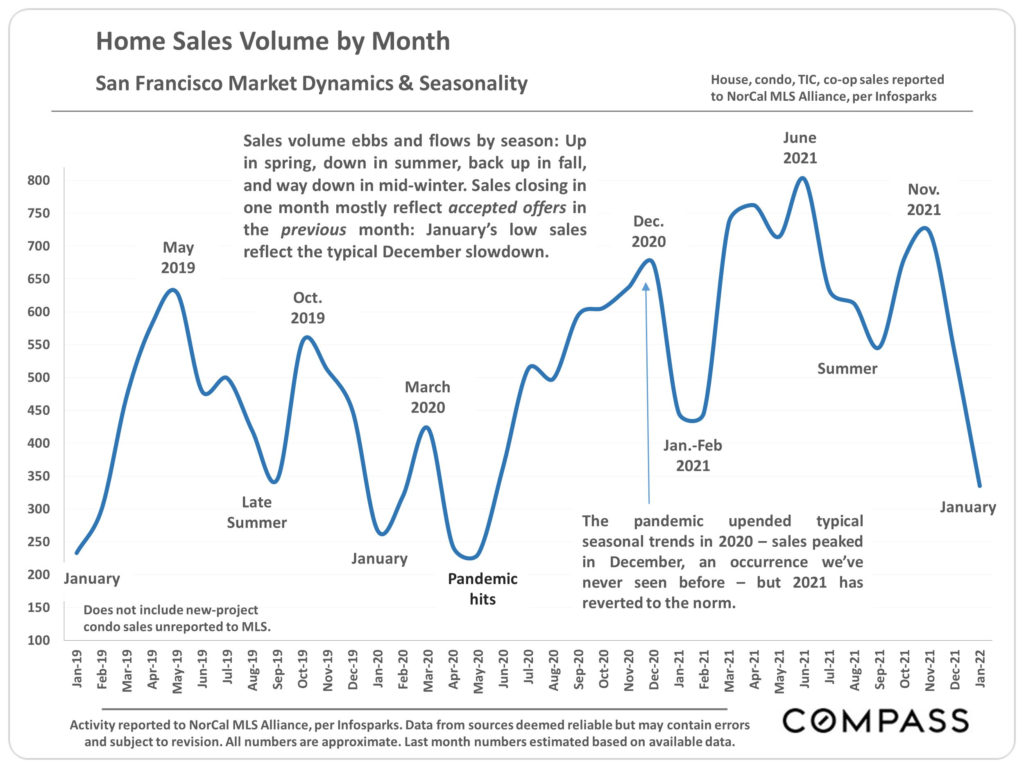
Home Sales Volume by Month
Home sales in January dipped to a typical low, reflecting the small number of homes accepting offers in December, when the market slows down.
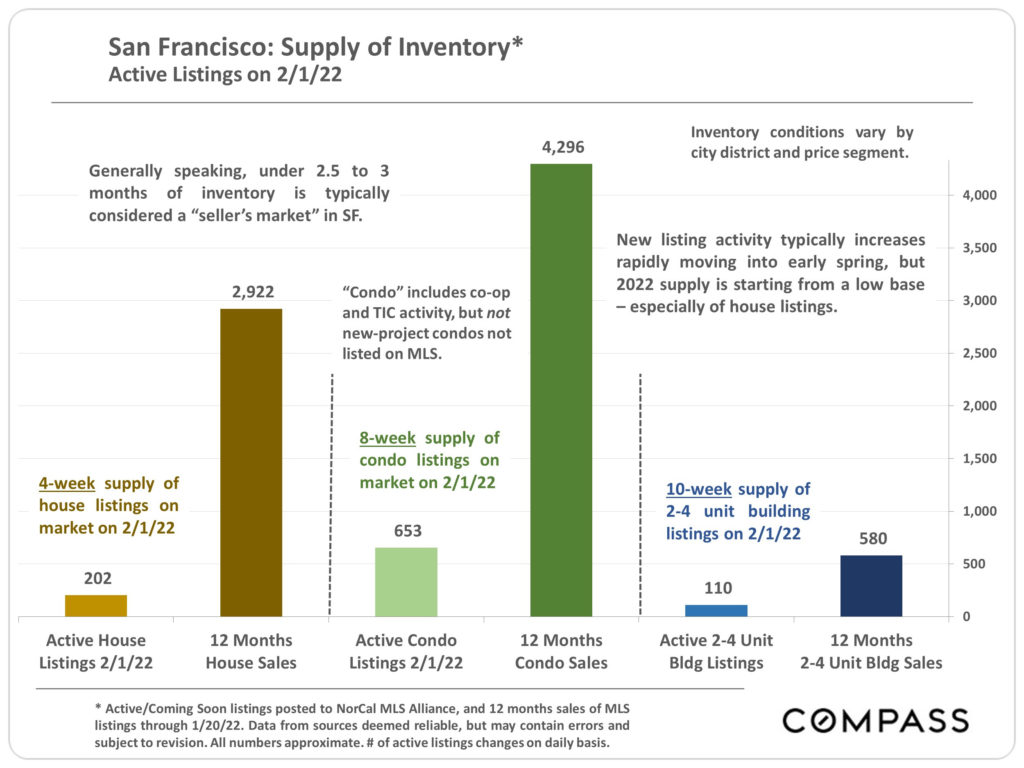
Supply of Inventory
The following chart shows the impact of limited inventory on real estate market in San Francisco. As of February 2, there was a 4-week supply of house listings, and an 8-week supply of condo listings on the market. Anything under 2.5-3 months of inventory is generally considered a seller’s market in San Francisco.
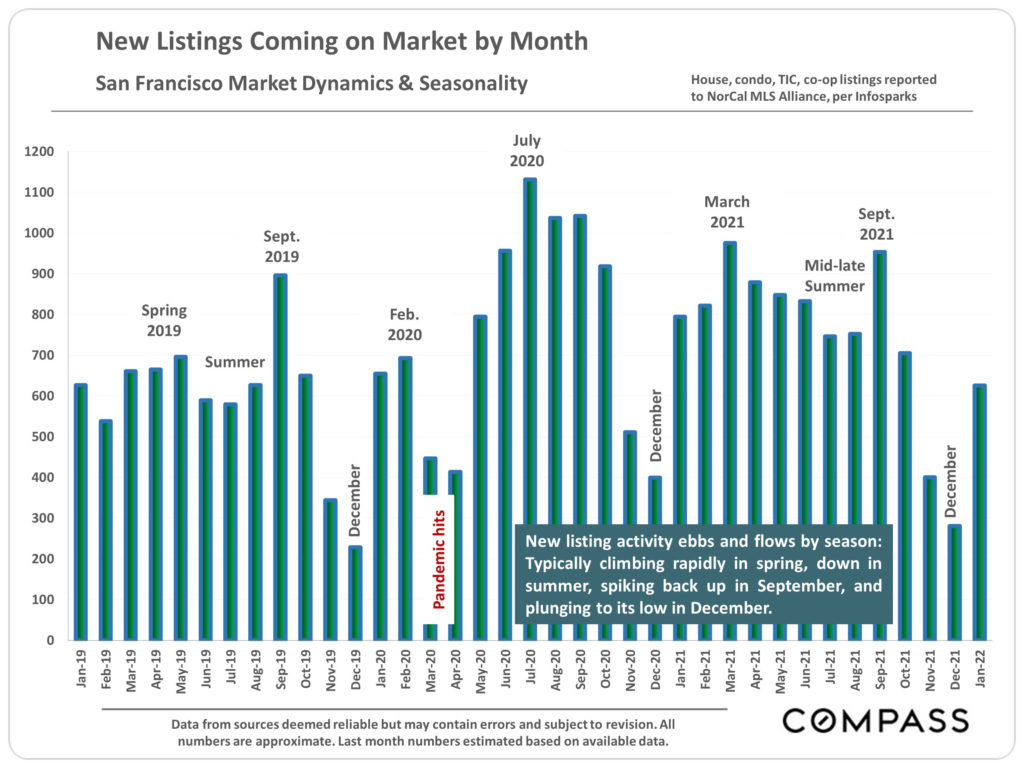
New Listings on the Market
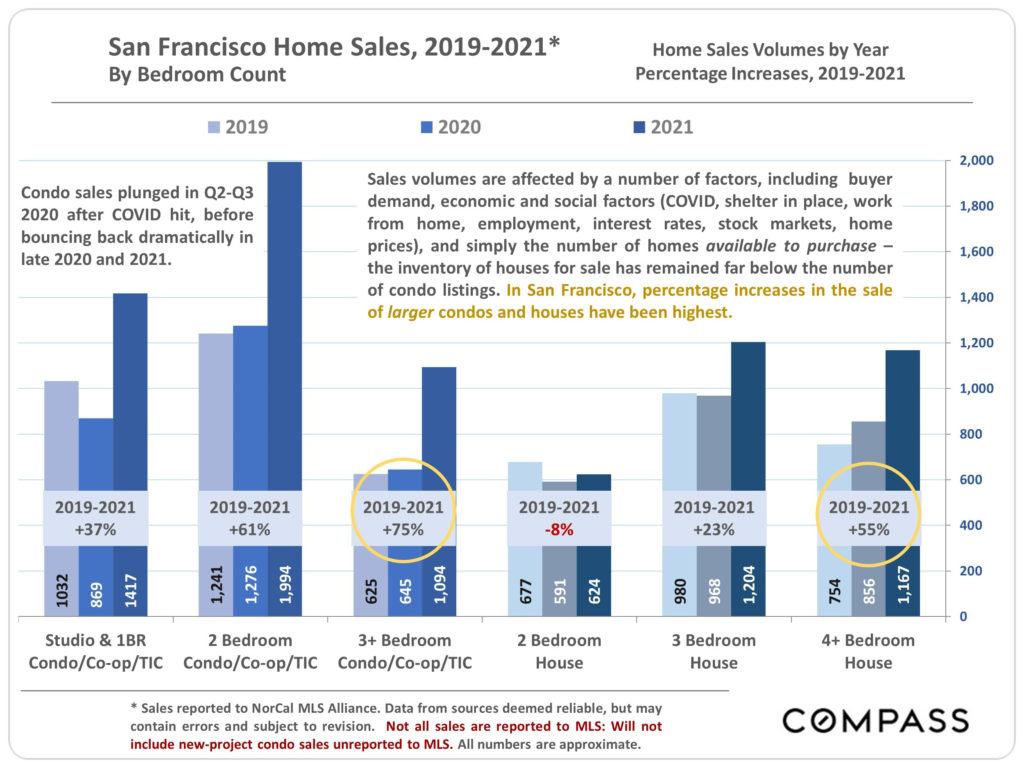
Home Sales Trends - 2019-2021
In the past three years, sales of larger condos and single family houses have increased the most, reflecting pandemic-related buyer demand for more space, home offices, and outdoor living space.
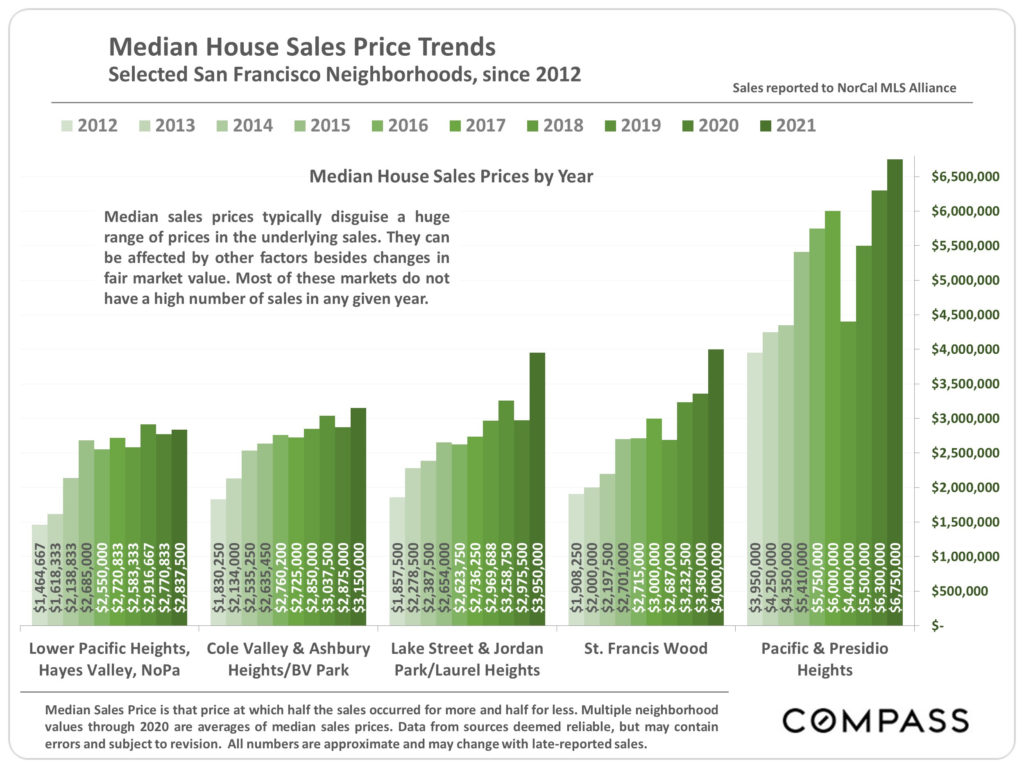
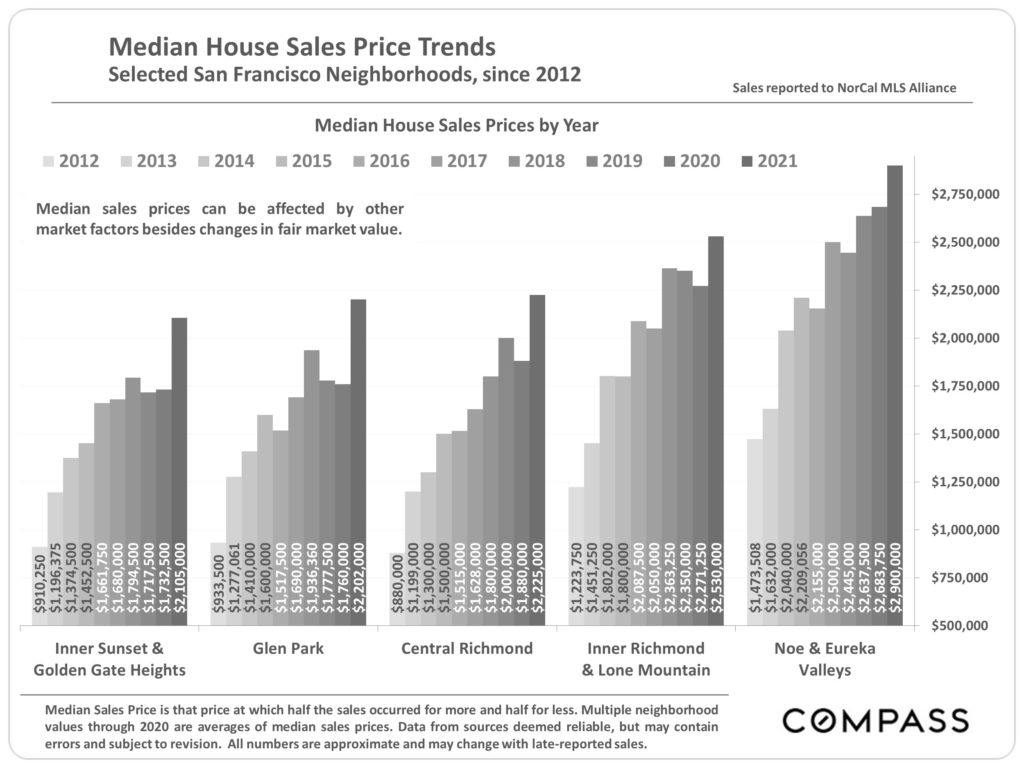
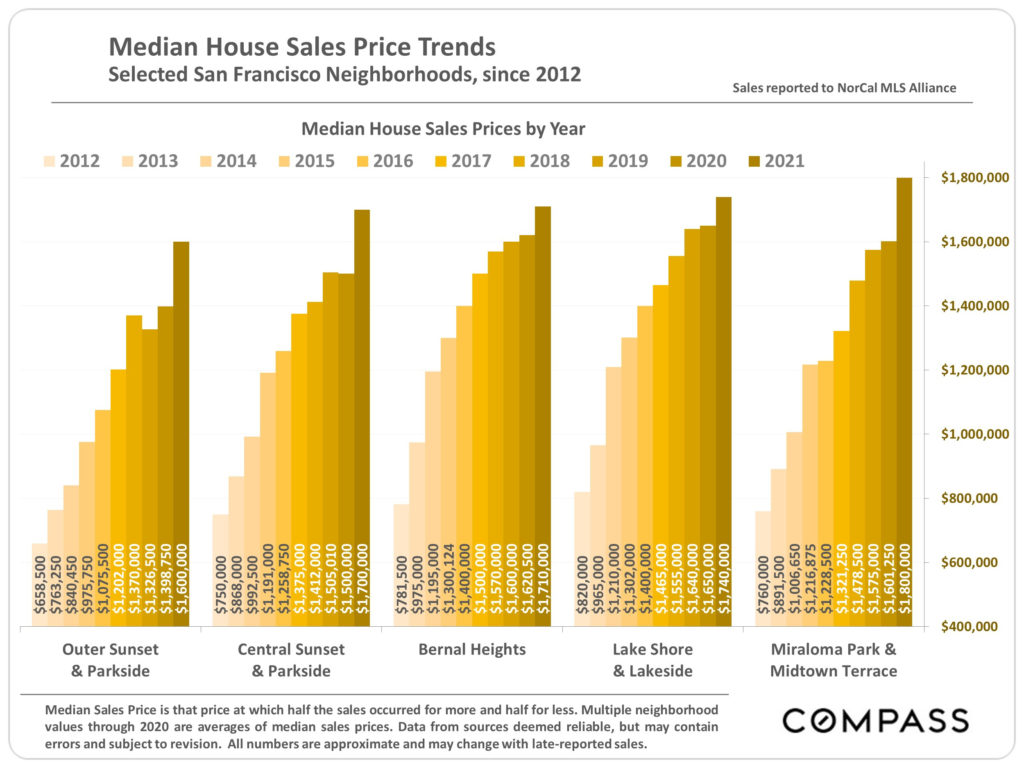
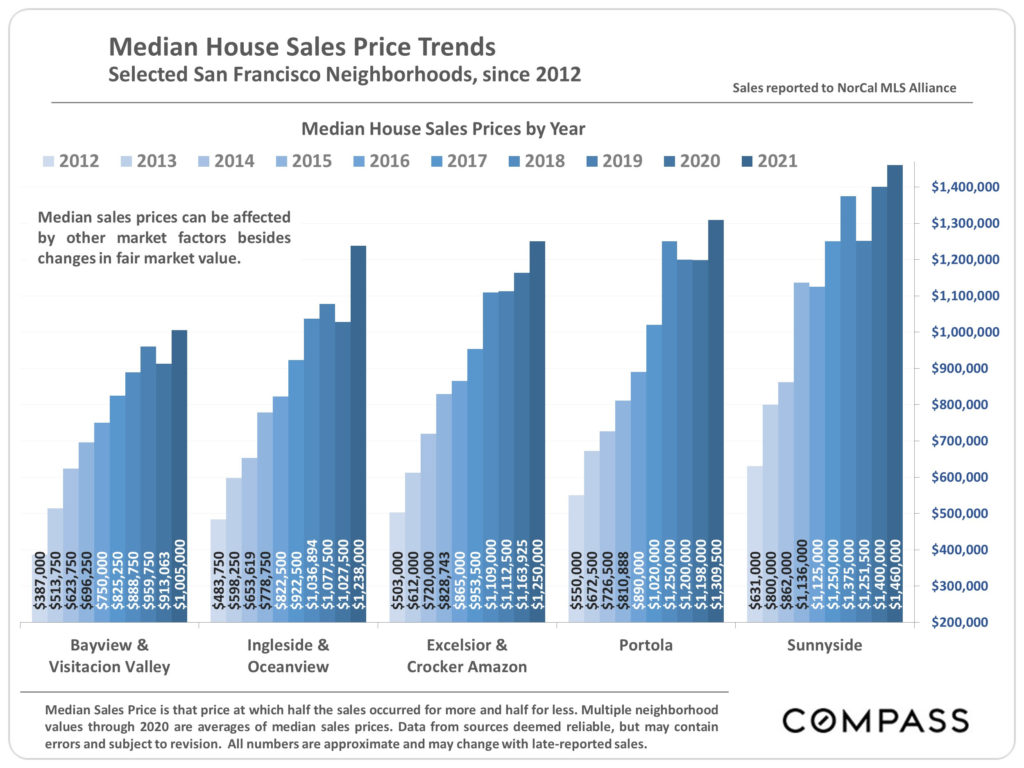
House Sales Price Trends by Neighborhood
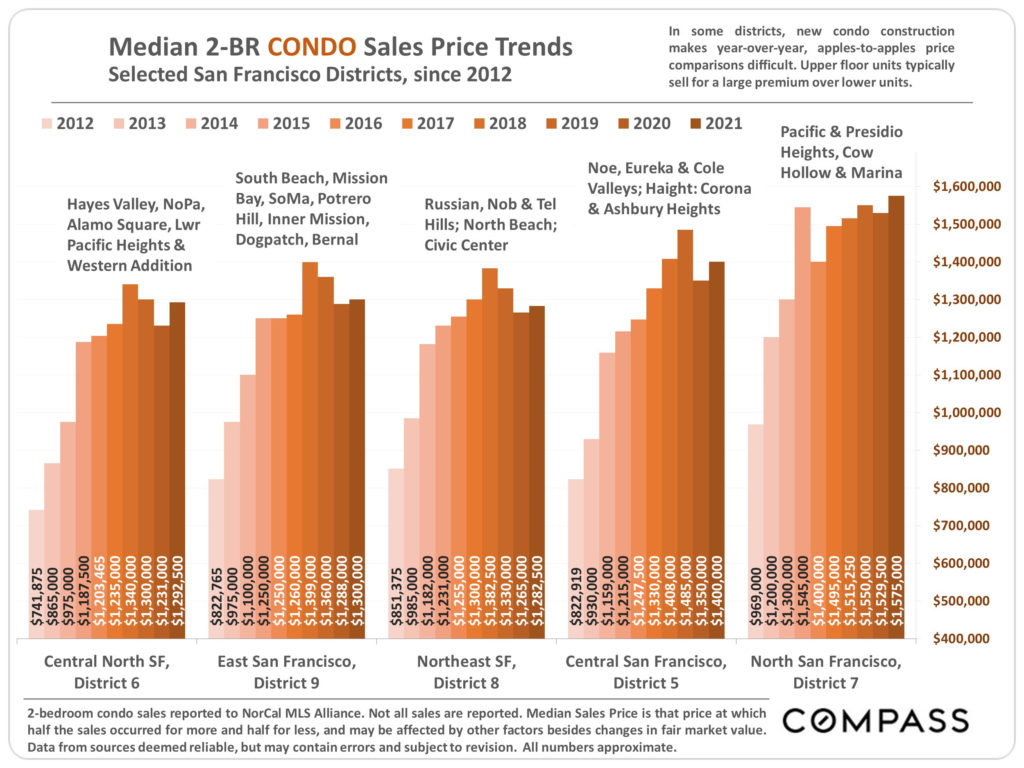
Condo Sales Trends in Select Districts
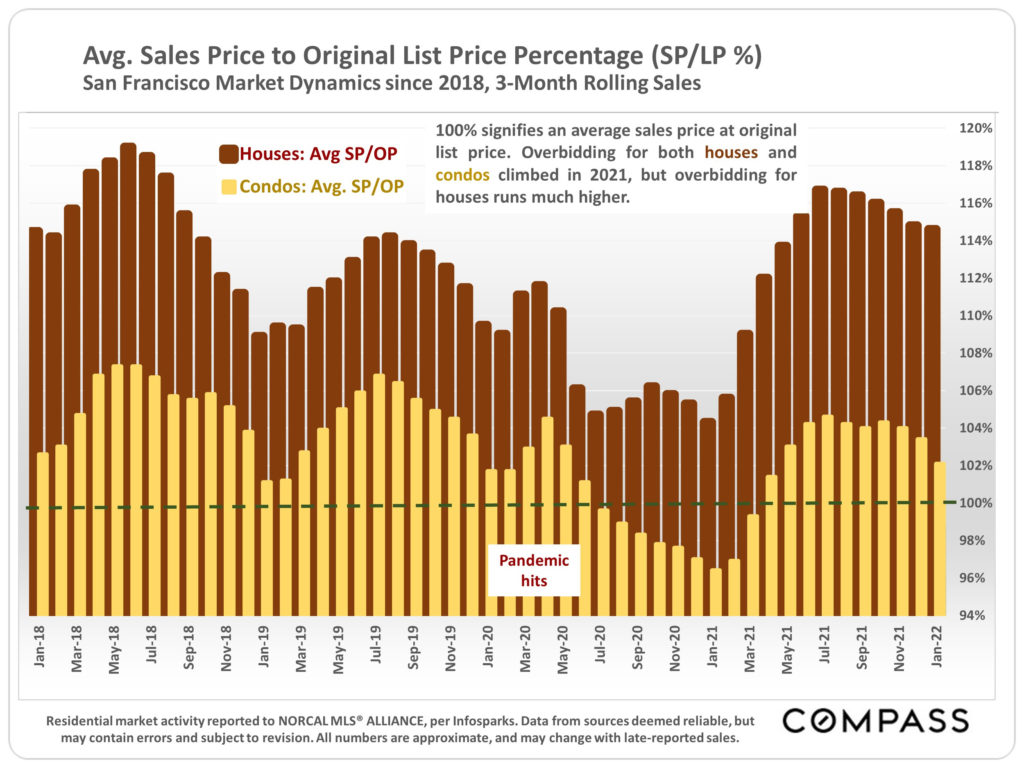
Average Sales Price to List Price
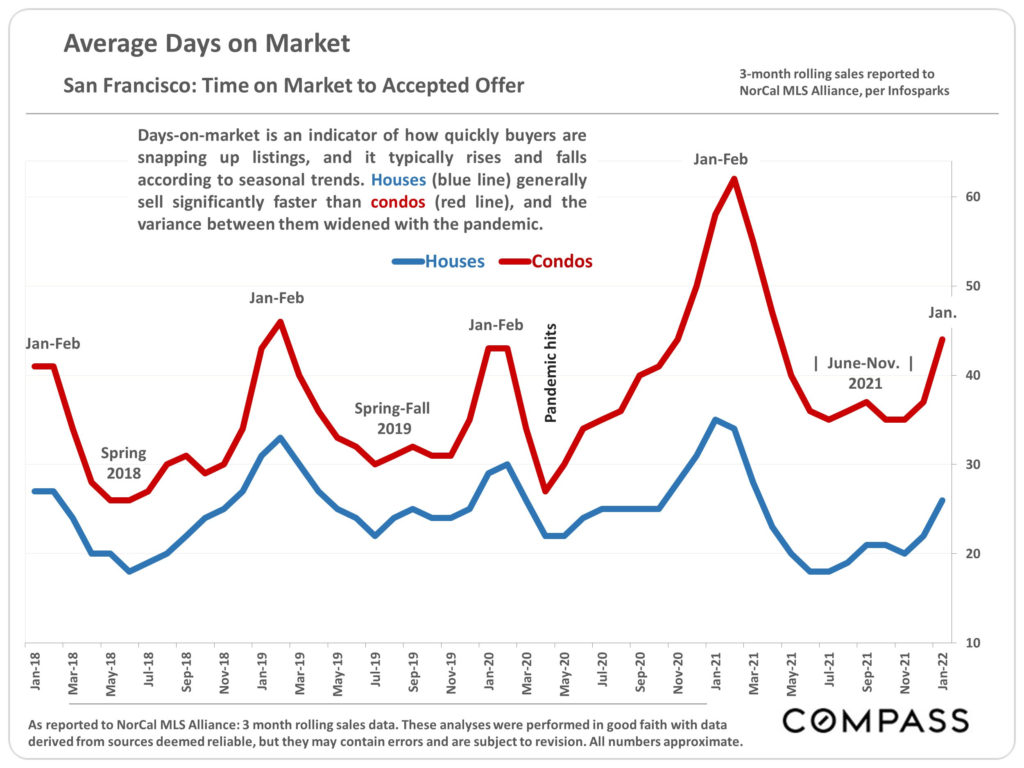
Average Days on Market
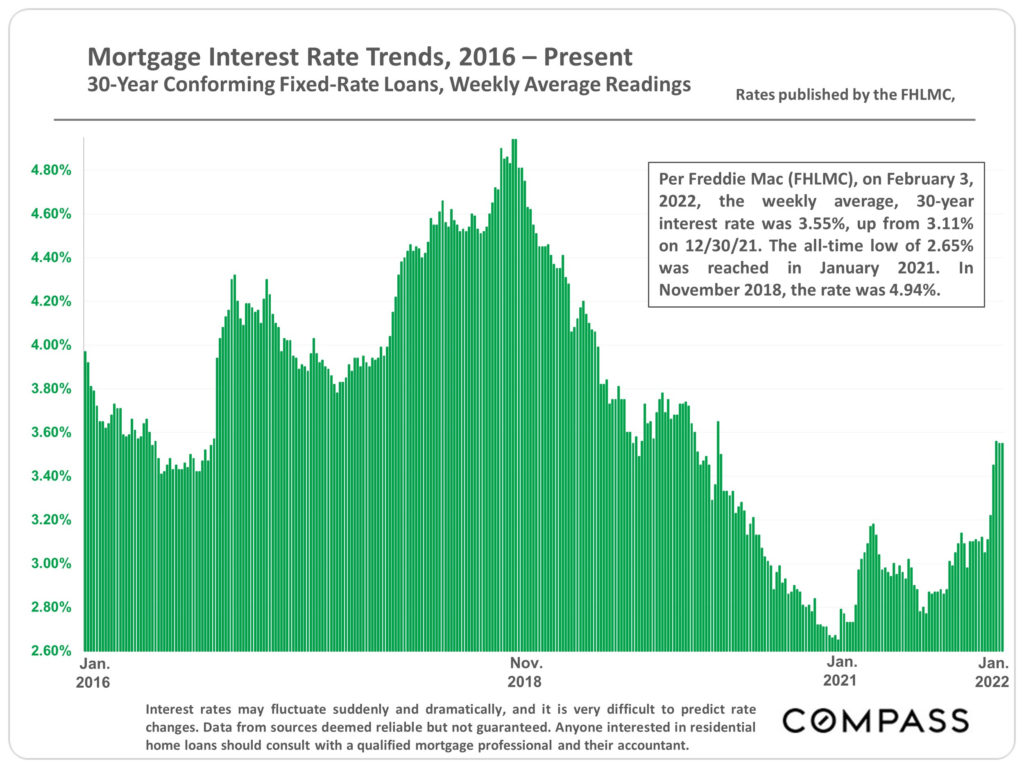
Mortgage Interest Rates
As anticipated, interests rates are starting to climb. On February 3, Freddie Mac reported that weekly average for a 30-year mortgage was up to 3.55% from 3.11% at the end of December.
The information herein is based on or derived from information generally available to the public and/or from sources believed to be reliable. No representation or warranty can be given with respect to the accuracy or completeness of the information.