This month, we are starting to see the impact of inflation and increasing interest rates on the market. After one of the longest upcycles in history, the market is seeing fewer offers and listings in contract, more homes for sale, and more price reductions.
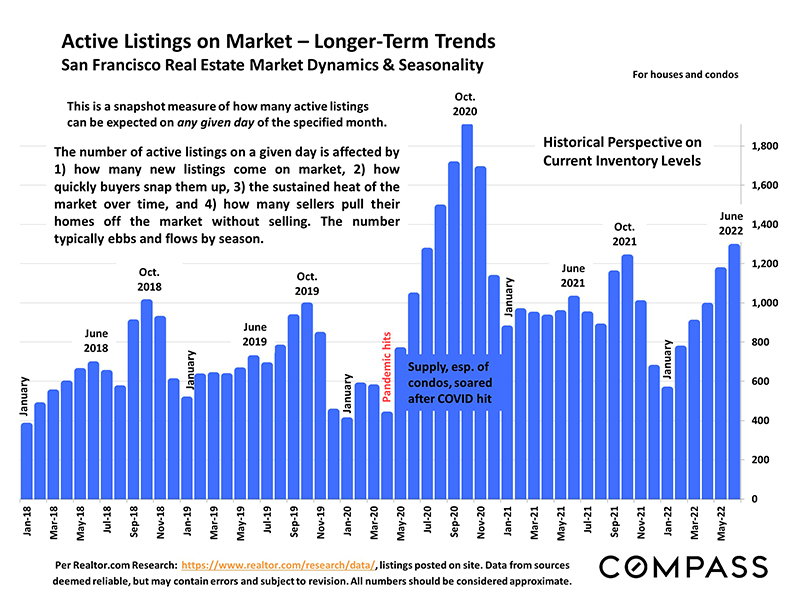
Monthly data can be volatile, and while year-over-year comparisons may paint a stark picture, the longer-term trends provide greater context to the recent changes in the market.
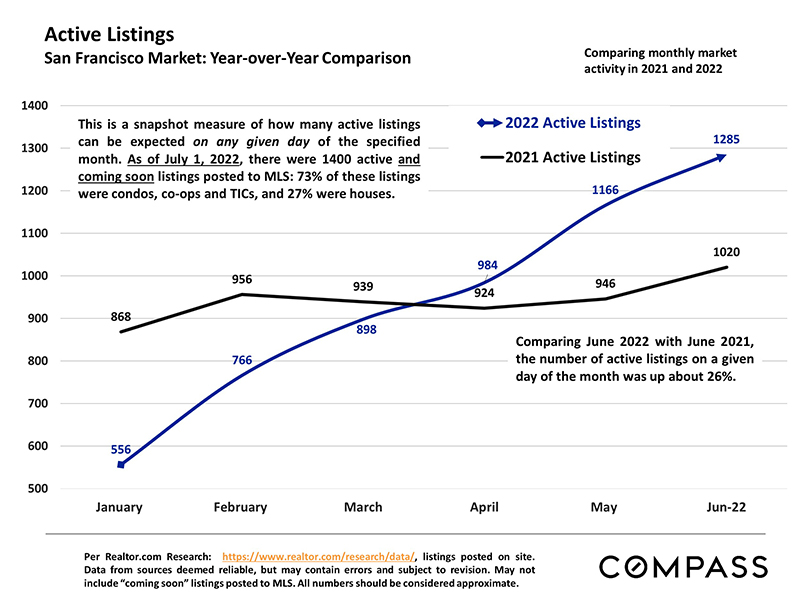
Active Listings
The majority of active listings currently on the market as of July 1 are condos, co-ops, and TICs, accounting for 73% of listings. Compared to last year, active listings were up by about 26% in June this year.
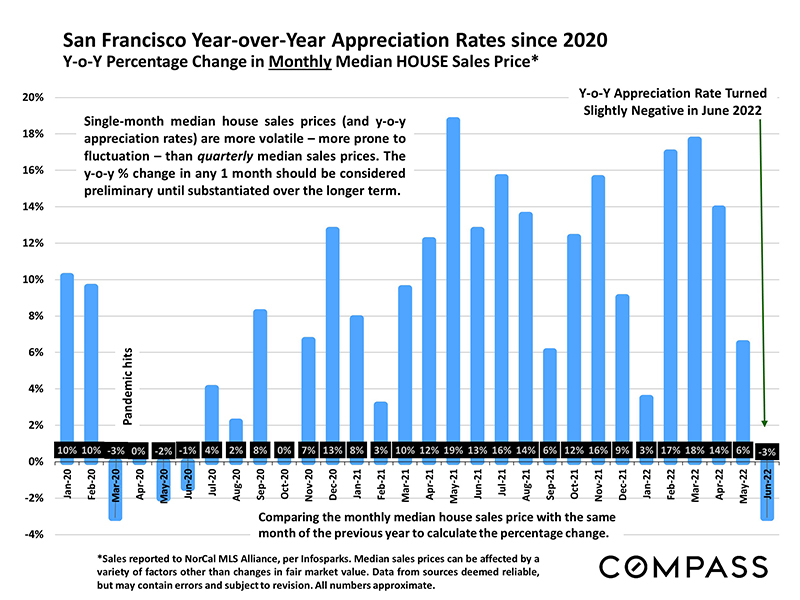
San Francisco Home Price Appreciation
In June, year-over-year appreciation turned slightly negative, reaching early pandemic levels from 2020. Median house sales in a single month and year-over-year appreciation rates can fluctuate wildly; longer-term data will provide a more accurate representation of appreciation trends.
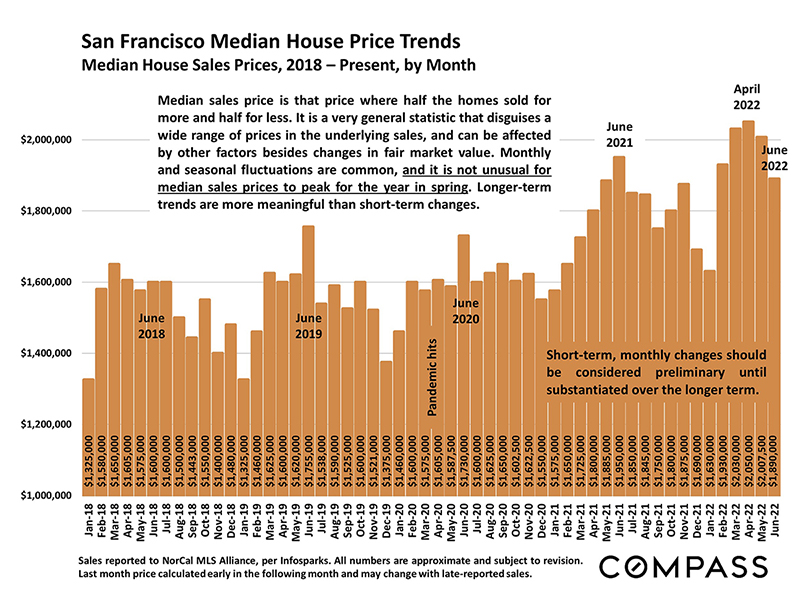
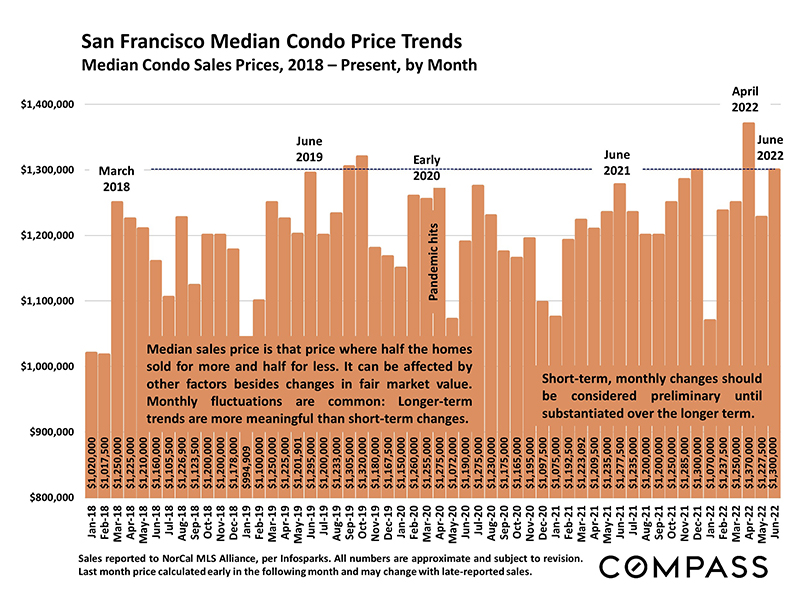
Median House and Condo Price Trends
Median house and condo sales priced commonly peak for the year in spring. Changes from month-to-month are a preliminary indication of price changes that need to be substantiated by longer-term data.
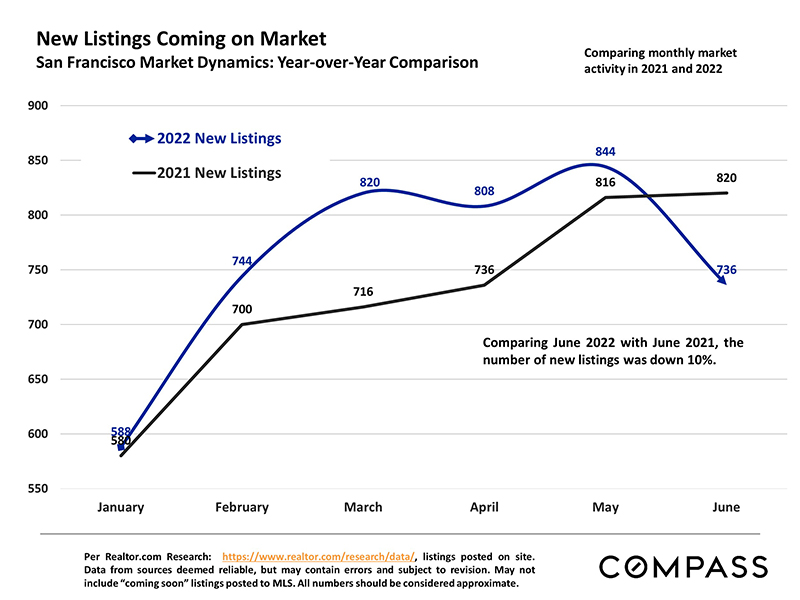
New Listings Coming on Market
New listings coming on the market decreased slightly in June, compared to listings in June of 2021.
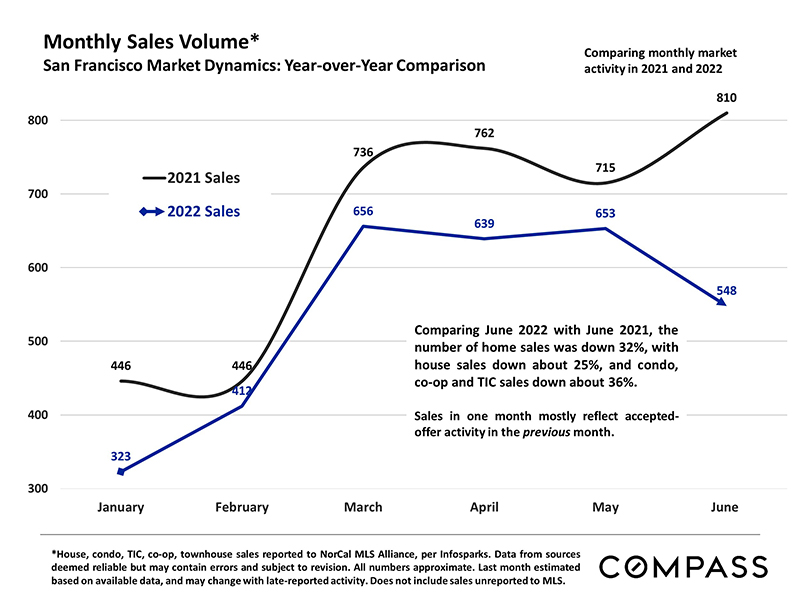
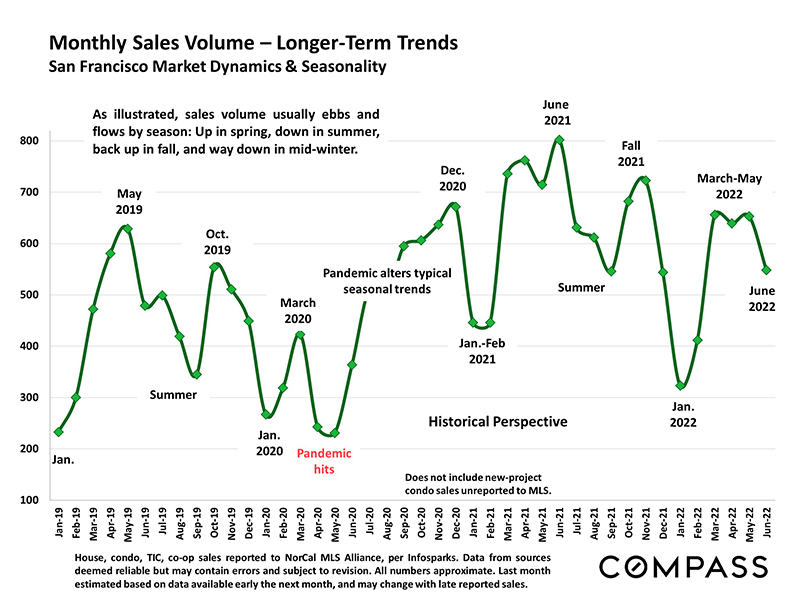
Monthly Sales Volume
In June, monthly sales volume for single-family homes was down about 25% compared to last year while condo, co-op and TIC sales were down about 36%. These figures mostly represent offers accepted in the previous month (May).
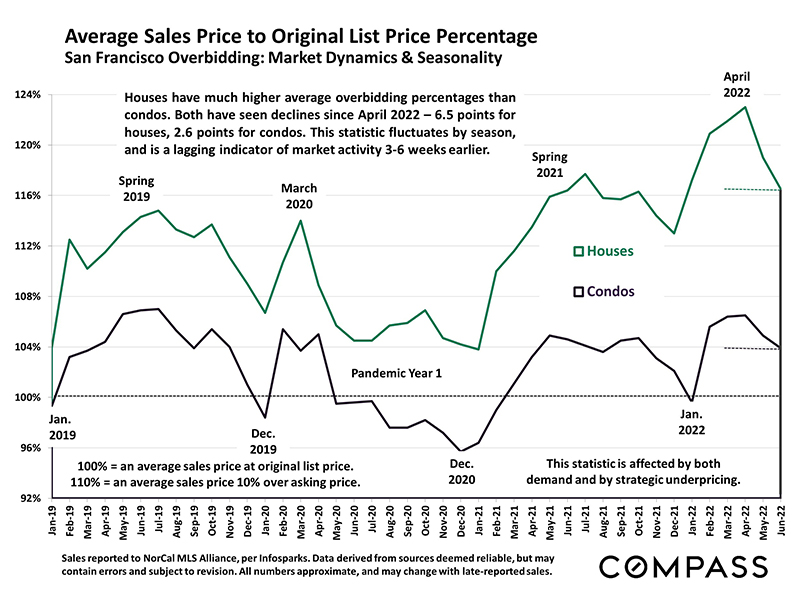
Average Sales Price to List Price
Reflecting the changing market, we are currently seeing a decline in overbidding percentages for both houses and condos, although that change is less significant for single-family homes.
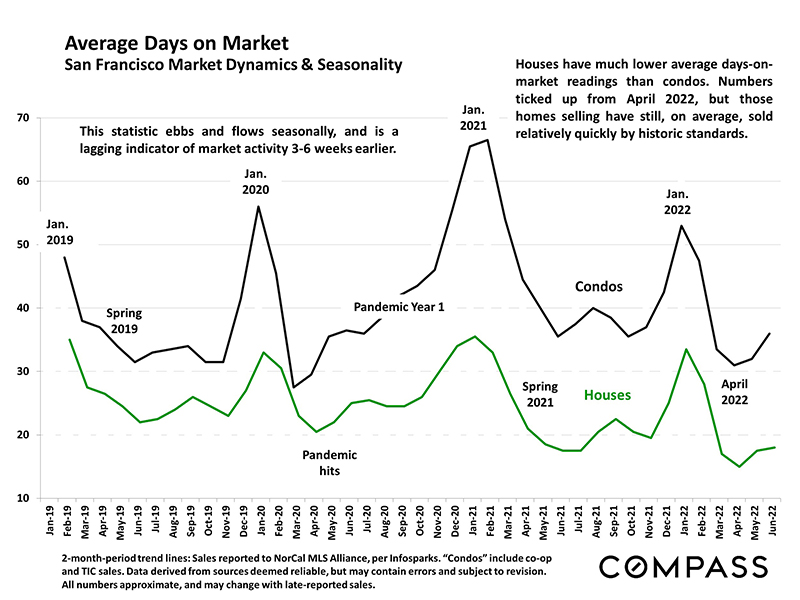
Average Days on Market
By historic standards, average days on market is still relatively low, particularly for single-family homes.
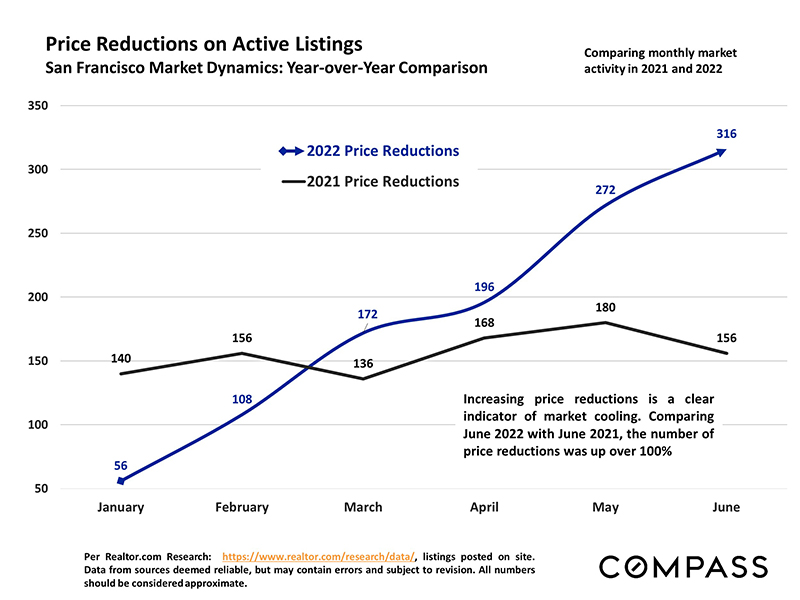
Price Reductions on Active Listings
The increase in price reductions from the beginning of the year until now is an indicator of a cooling market. We will likely see price corrections in the market in the coming months as sellers adjust their expectations in response to changing demand.
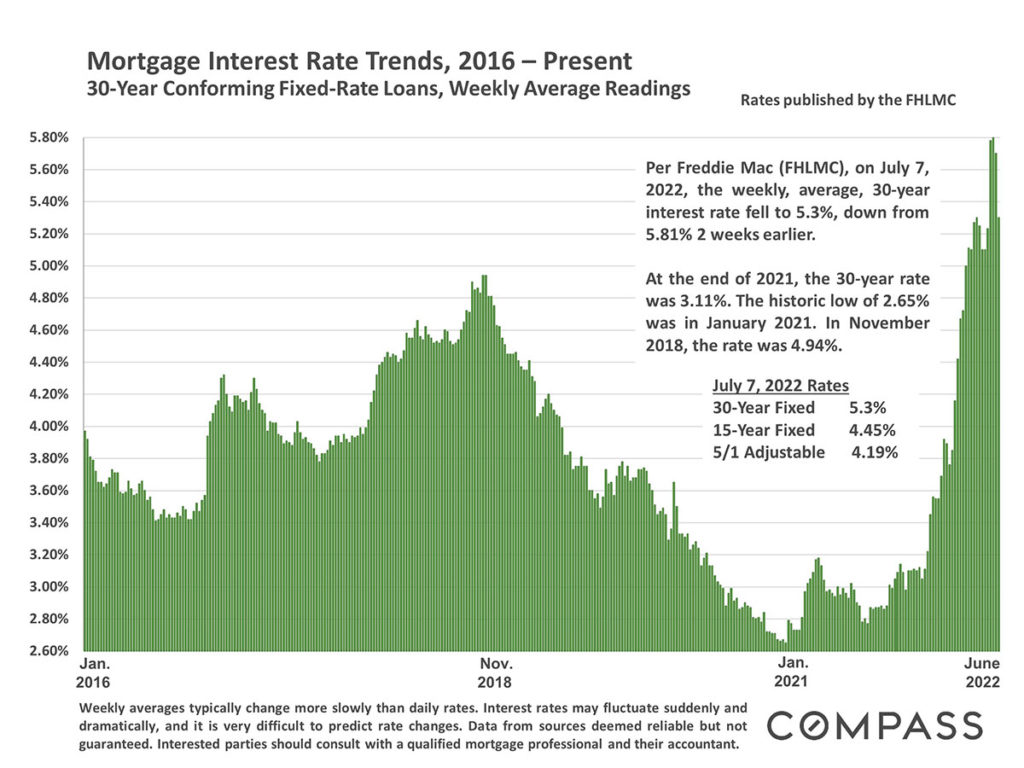
Mortgage Rates
Mortgage rates continue to change as economic growth slows due to fiscal and monetary drags. As of July 7, Freddie Mac reported a 30-year average fixed mortgage rate of 5.3%, which was slightly down from the 5.81% rate reported two weeks earlier. As of July 14, the rate increased slightly to 5.51%.
The information herein is based on or derived from information generally available to the public and/or from sources believed to be reliable. No representation or warranty can be given with respect to the accuracy or completeness of the information.