While signs of a slower spring market were evident nationally and in the Bay Area, many of these indicators of slowdown did not occur in San Francisco. In the city, median sales prices rose, inventory remained steady, and both the number of listings going into contract and the percentage of sales sold for over asking price increased.
Virtually all of the May sales were negotiated before the May 12 reversal of the China tariff policies, which triggered a rebound in the stock market. Unlike stocks, home sales don’t reflect shifts in market conditions so quickly—there is typically a 3-to-6-week lag between offer acceptance and close of sale. While uncertainty regarding the economy made some buyers and sellers hesitant about moving forward, there are indications that the impact of April’s negative economic activity may already be fading.
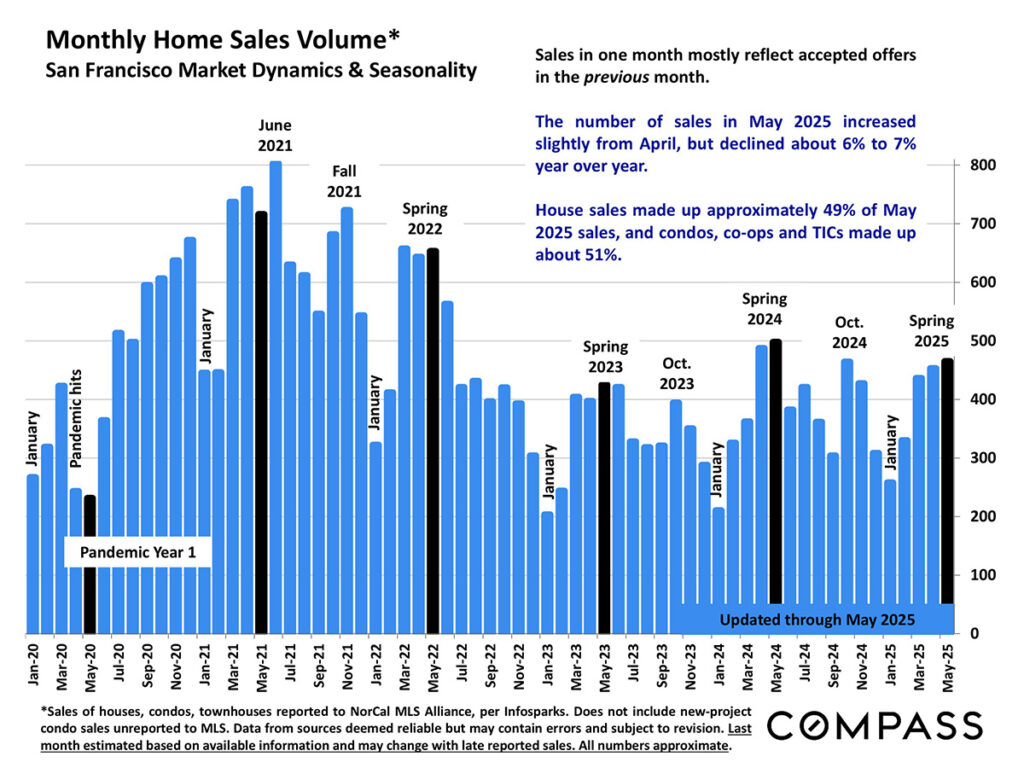
Home Sales Volume
The number of sales in May increased slightly from April, but was down about 6-7% year-over-year. House sales made up 49% of May 2025 sales, while condos, co-ops, and TICs accounted for 51%.
Value Trends
New Listings
While the number of new listings coming on the market in May 2025 declined from April, it was unchanged compared to May of 2024.
Active and Coming Soon Listings
Listings for sale on June 1, 2025 were down from the previous month, but up compared to June 1, 2024. Houses accounted for 30.5% of listings, while 59% were condos, 7% TICs, 2.5% co-ops, and 1% townhouses.
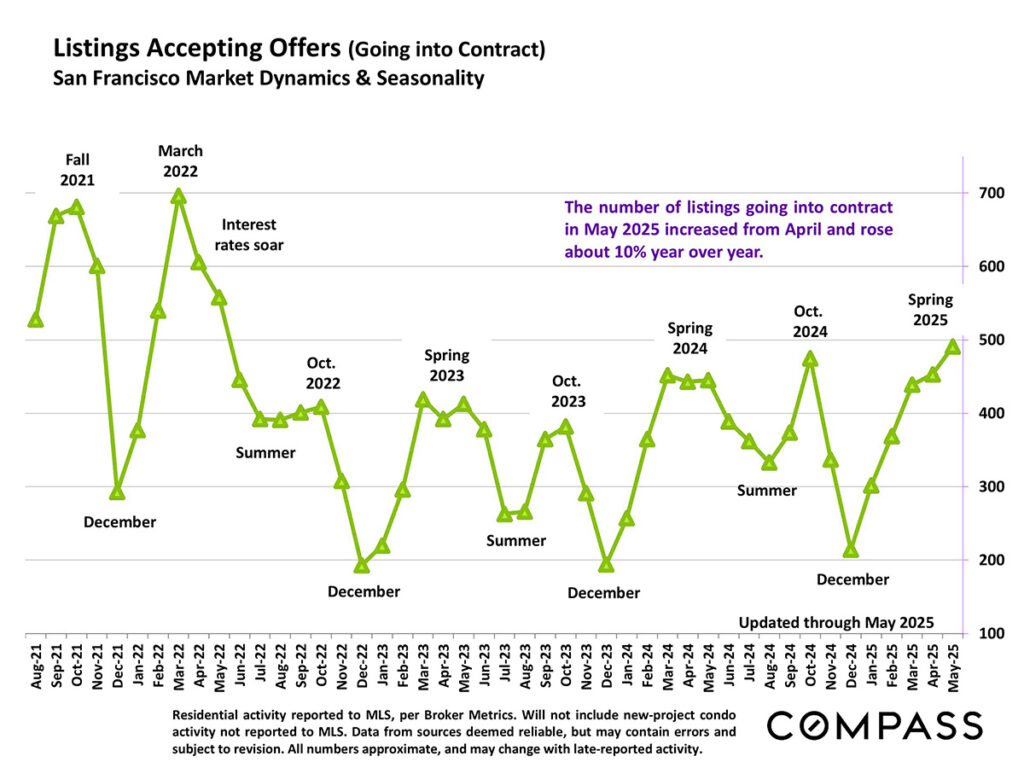
Listings Accepting Offers
The number of listings going into contract in May 2025 increased from the previous month and rose about 10% compared to May of 2024.
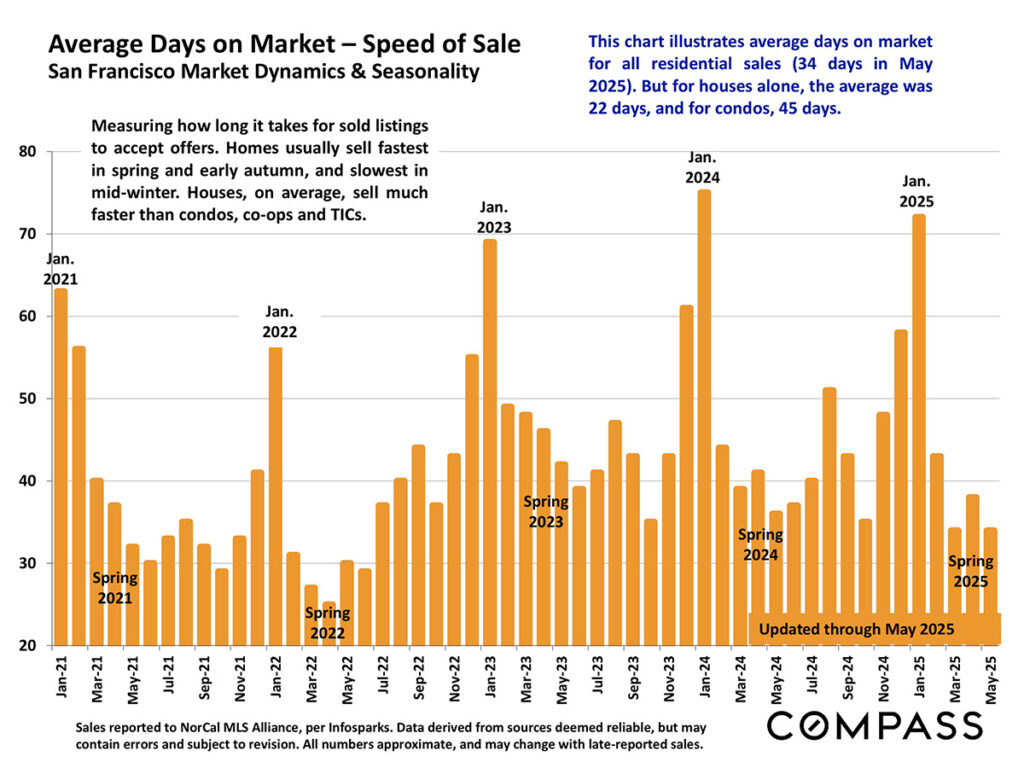
Average Days on Market
The average days on market was 34 in May 2025, with houses alone averaging 22 days and condos 45 days.
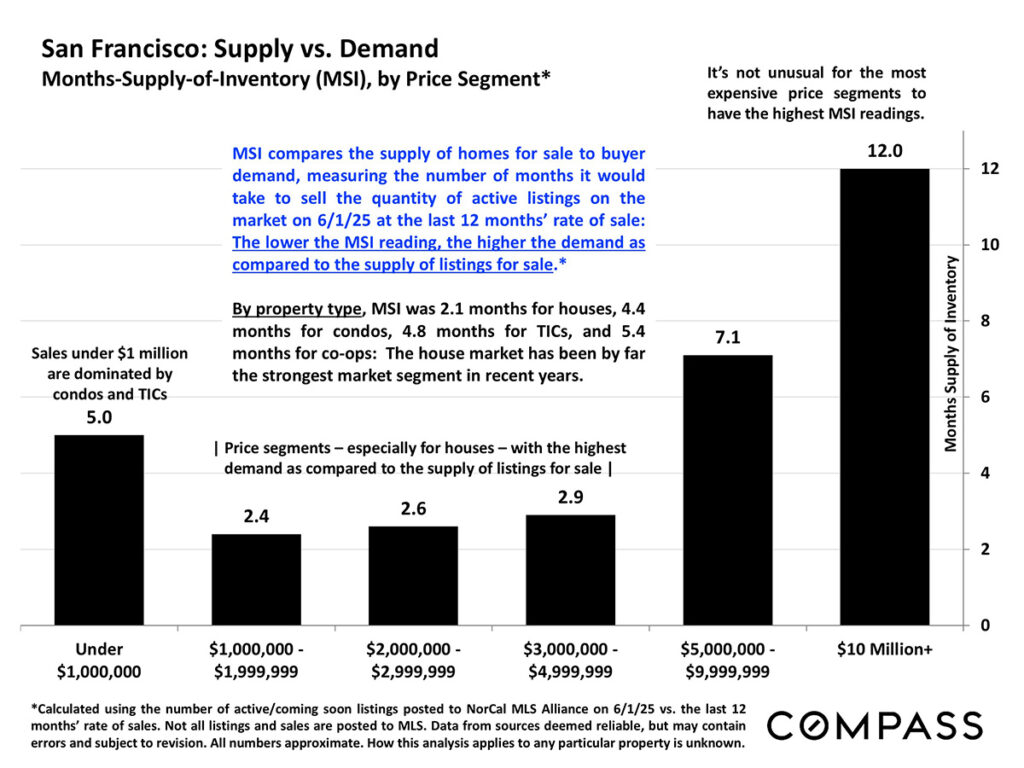
Months Supply of Inventory by Price Segment
The lower the Months Supply of Inventory (MSI) reading, the higher the demand as compared to the supply of listings for sale. Typically, the most expensive price segments have the highest MSI readings.
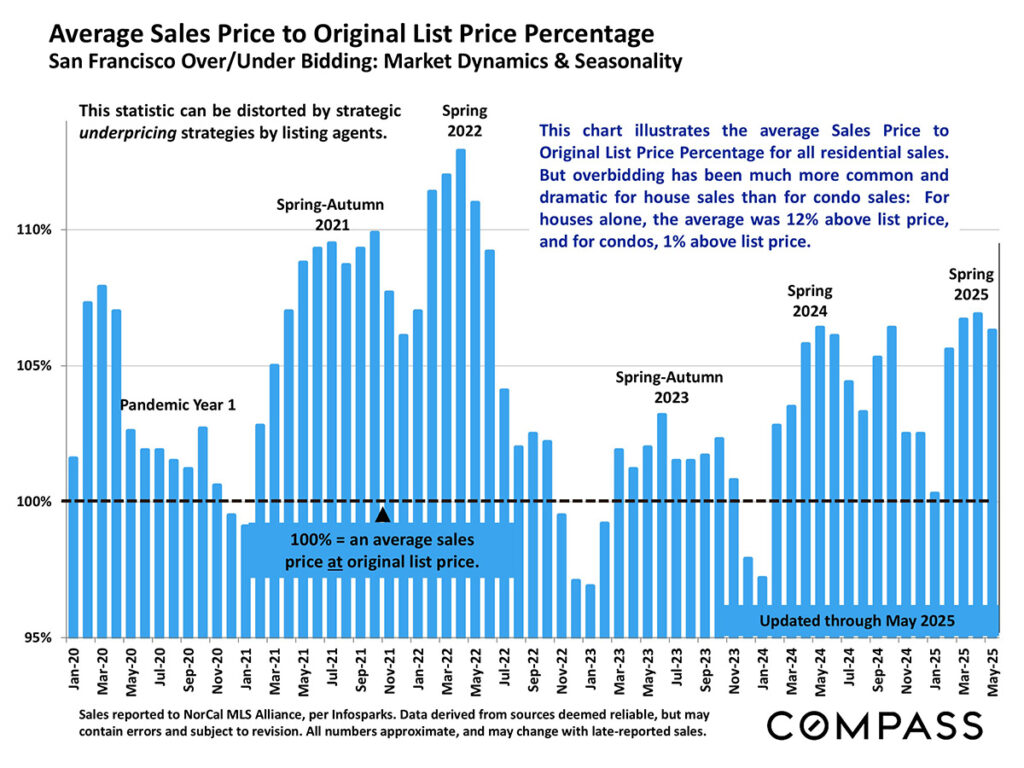
Sales Over List Price
Overbidding of list price has been much more common for houses than condos. For houses alone, the average sale price was 12% above list price. Condos saw an average of just 1% over list price.
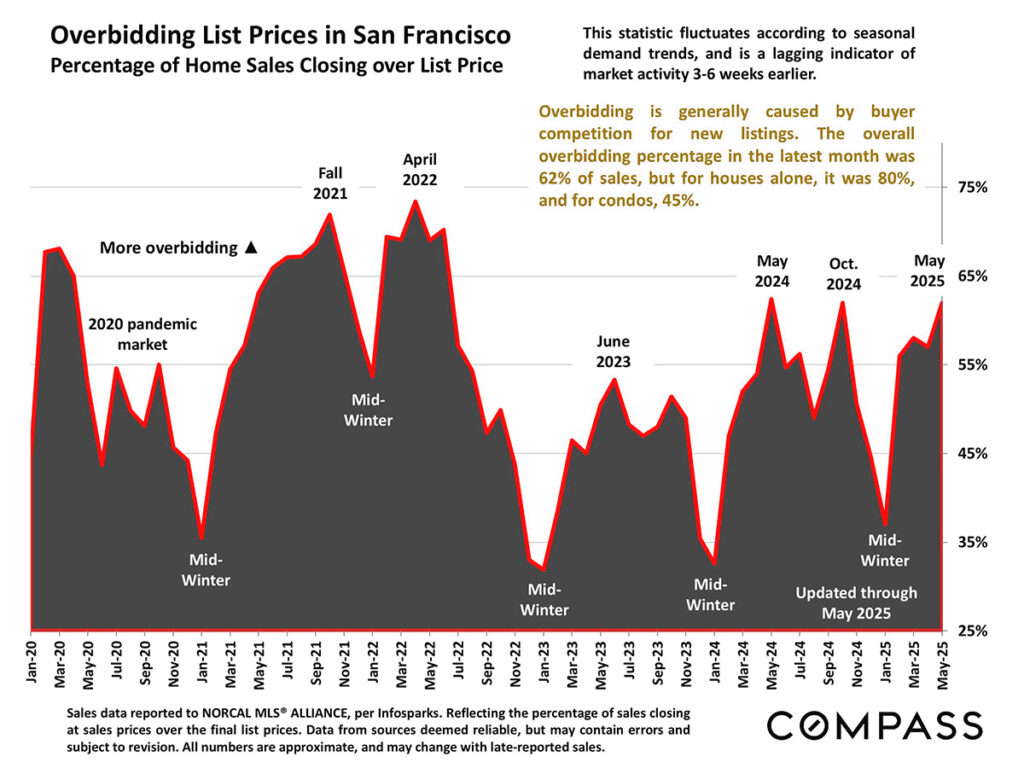
Overbidding List Prices
62% of all sales in May 2025 saw overbidding above the list price. For houses alone, it was 80% of sales, while for condos it was 45%.
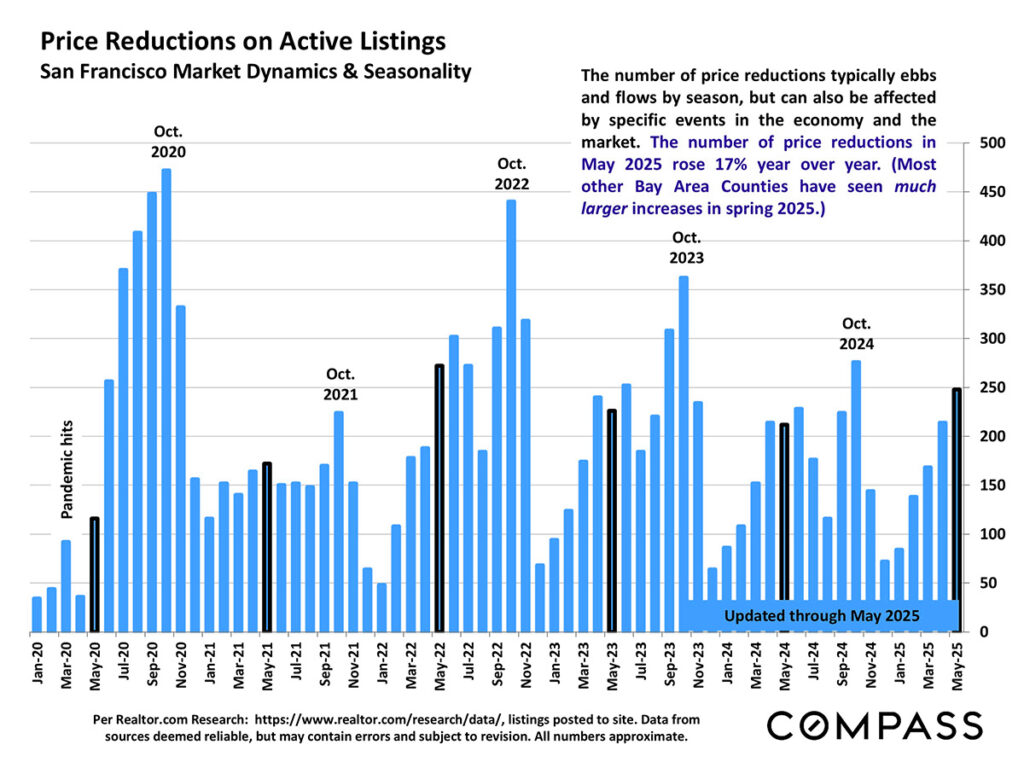
Price Reductions on Active Listings
Price reductions in May 2025 rose 17% compared to May 2024. Most other Bay Area counties saw a much more substantial increase in price reductions this spring.
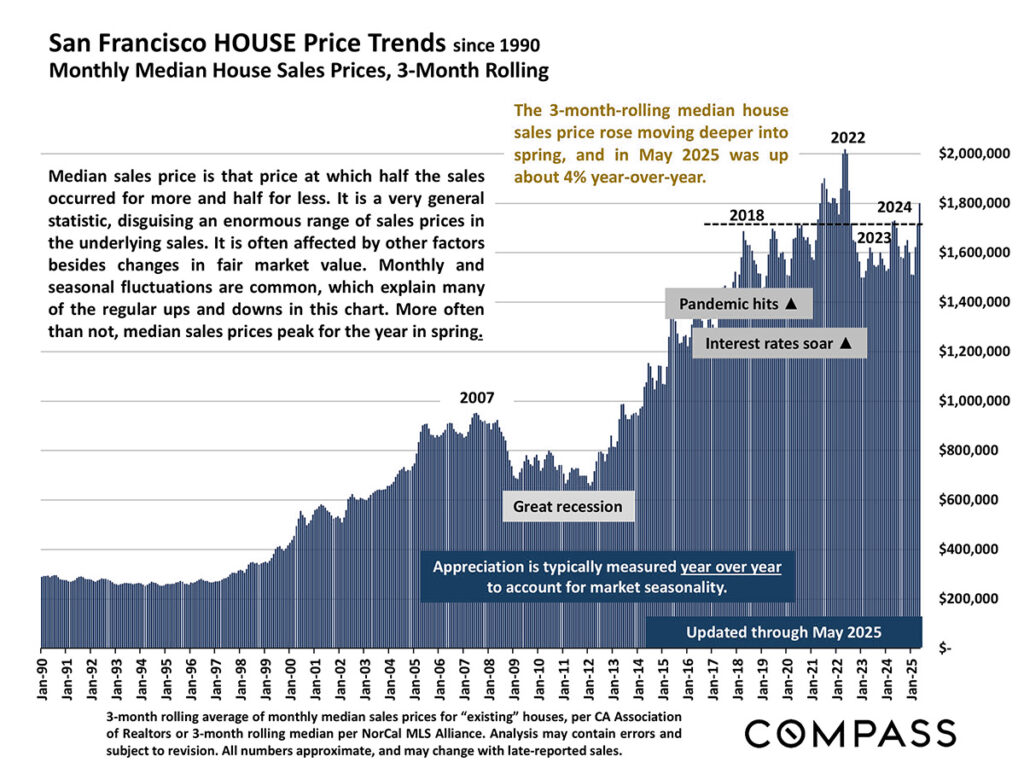
House Price Trends
In May 2025, the 3-month-rolling median house sales price was up about 4% compared to May 2024.
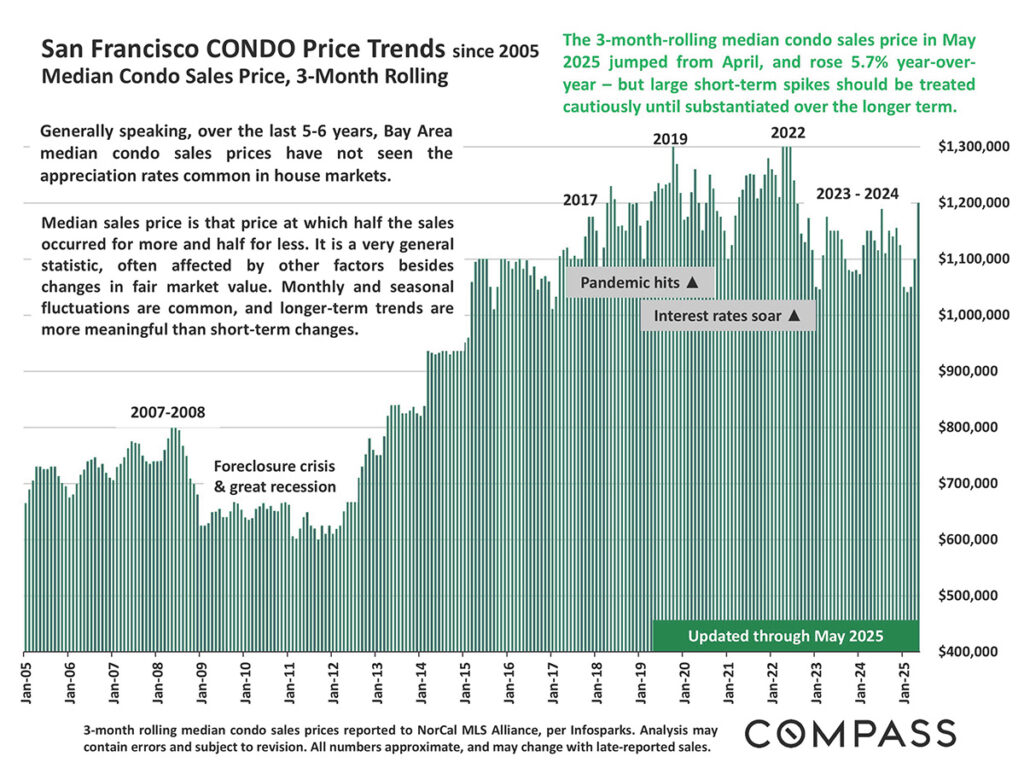
Condo Price Trends
In May 2025, the 3-month-rolling median condo sales increased substantially from April was rose 5.7% compared to May 2024.
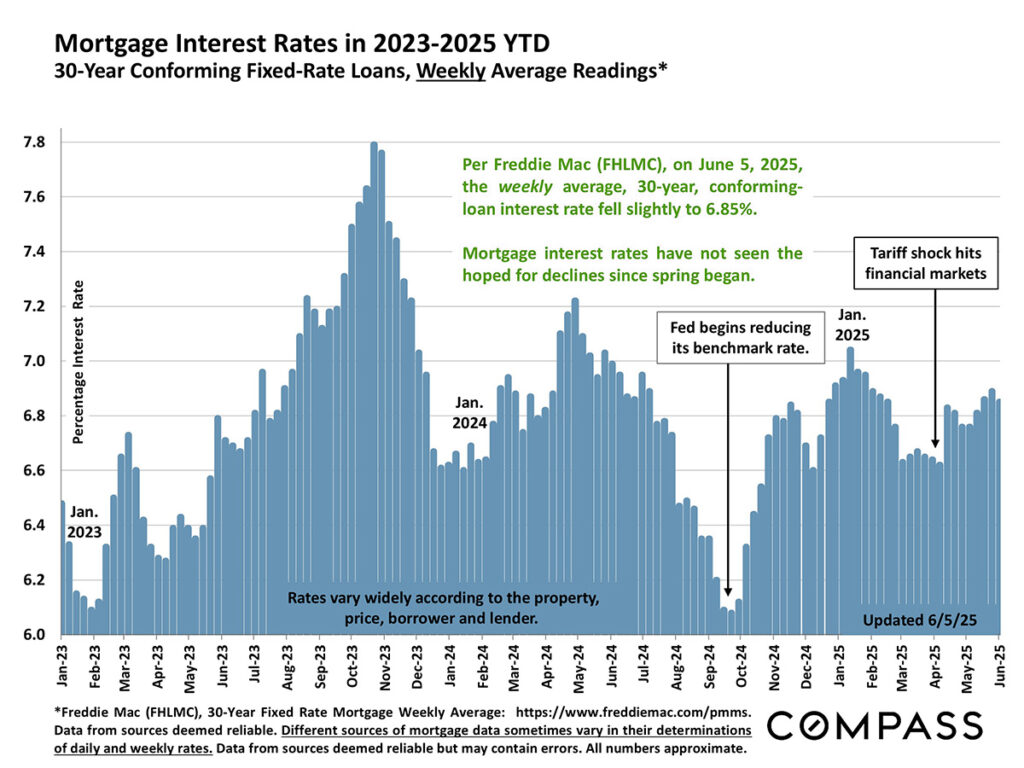
Mortgage Rates
As of June 5, 2025, the weekly, average 30-year conforming loan interest rate fell a bit to 6.85%.
The information herein is based on or derived from information generally available to the public and/or from sources believed to be reliable. No representation or warranty can be given with respect to the accuracy or completeness of the information.