Real Estate Market Update for November 2019
What’s New in San Francisco Real Estate
Analytics and charts from Compass

Fall Market Highlights Through October
The San Francisco Association of Realtors recently released figures for October. The median sales price for single family homes in October was $1,650,000, up 3.1 percent over October 2018. The median sales price for condos and lofts was $1,350,000, up 8.0 percent over October of last year.
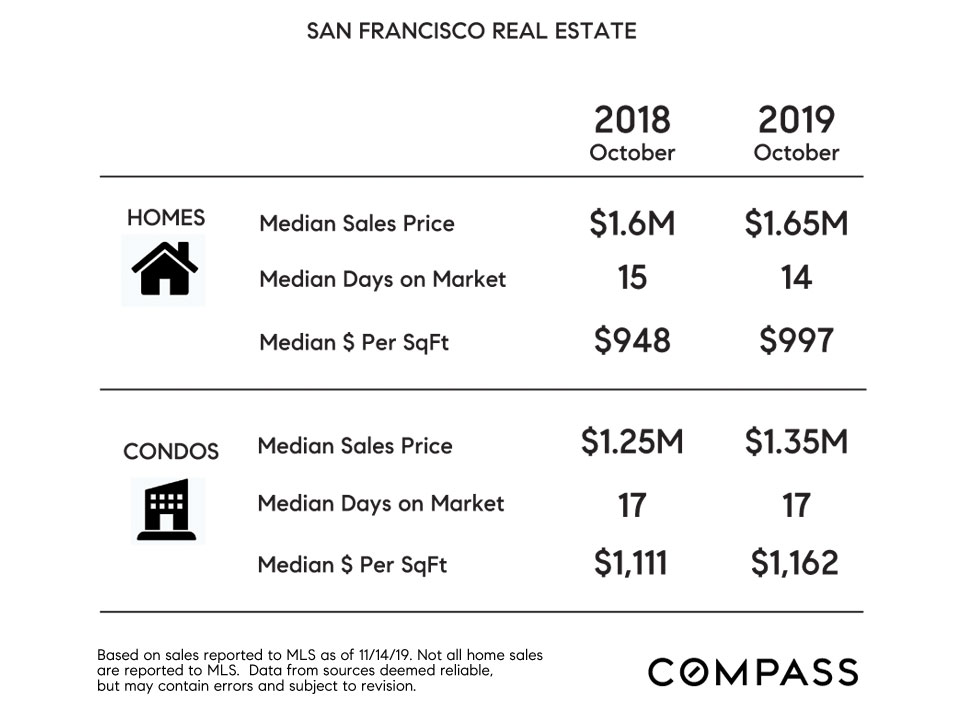
There were 206 new single family home listings in October, and 246 new condo and loft listings. In comparison to October 2018, that’s down 20.2 percent for single family homes, and down 18.5 percent for condos and lofts.
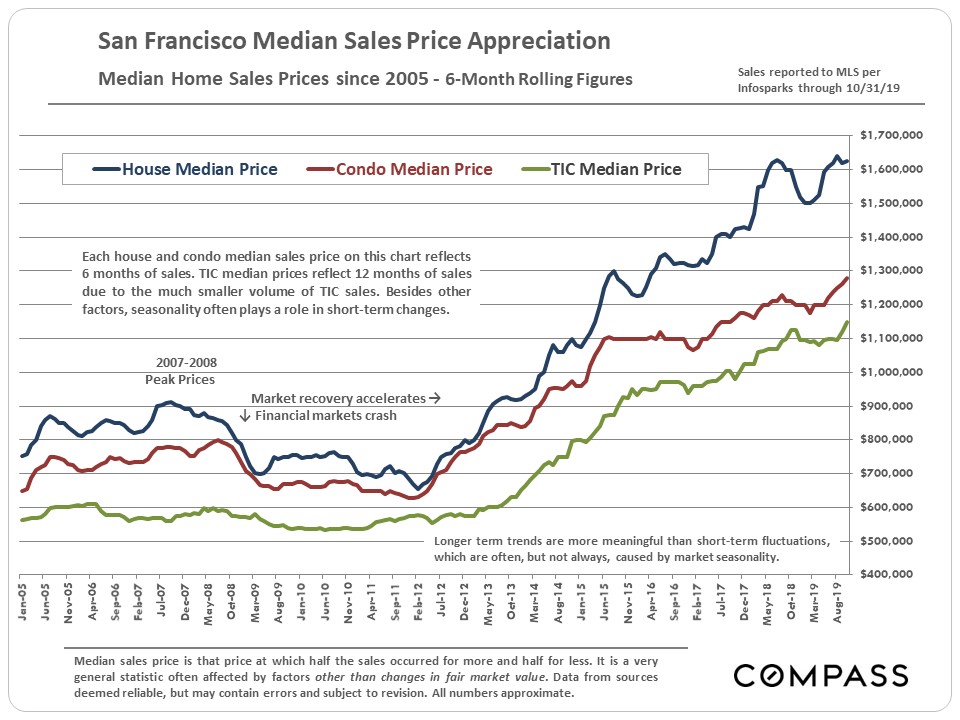
Median Home Price Trends Since 2005
The chart below shows the broader, long-term appreciation trends using six-month-rolling figures for home prices in San Francisco from 2005 through October 31, 2019.
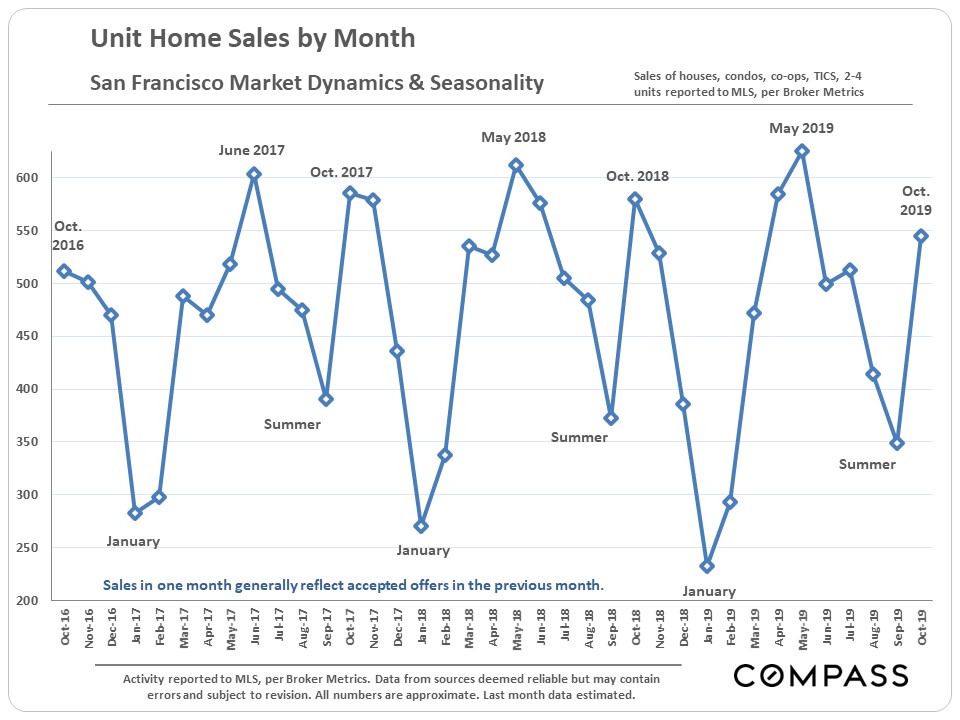
Home Sales Volume by Month
Starting in November activity begins to plunge towards the mid-winter low point. November sales volume mostly reflects offers accepted in October. Market activity is lowest in December, which makes January the month with the lowest sales volume.
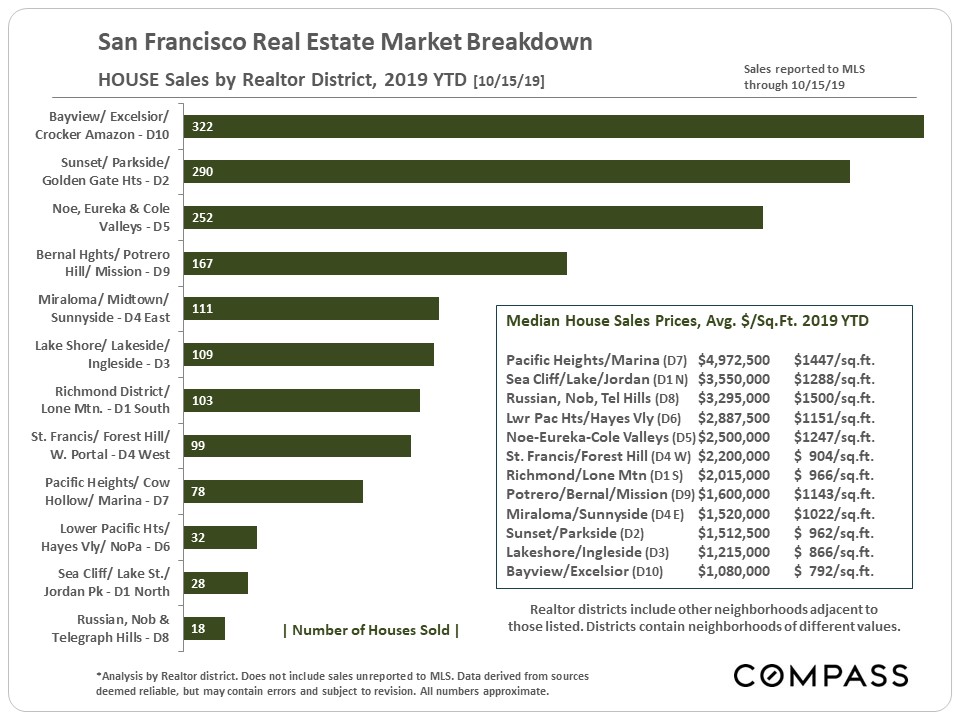
Home Sales and Median Price By District
HOUSE Sales & Median Sales Prices
Note that districts often include neighborhoods of varying values and that the district median sales prices quoted reflect combined sales. Median prices are broad generalities useful for comparative values and home-price trends, but how they apply to any particular home is unknown without a specific comparative market analysis.
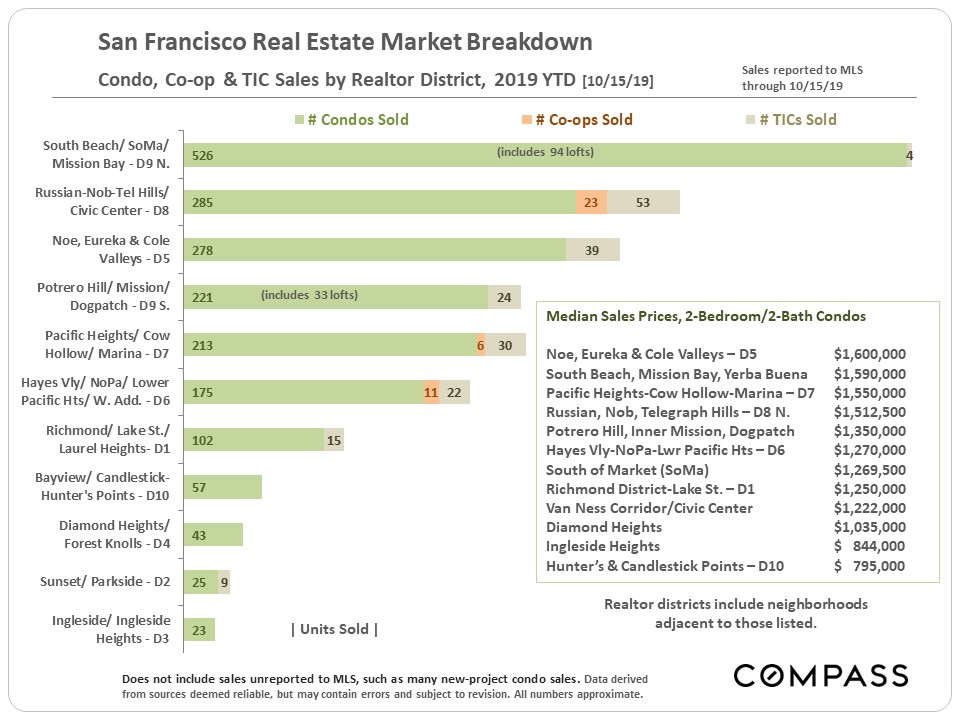
Condo, Co-op & TIC Sales by District
2-BR, 2-BA Condo Median Sales Prices
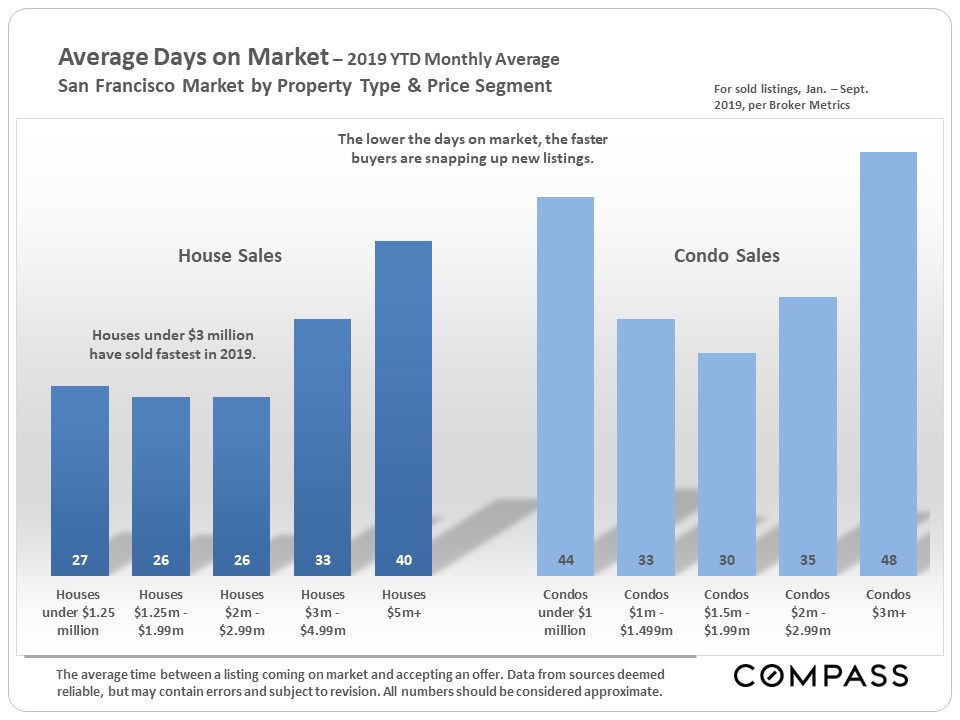
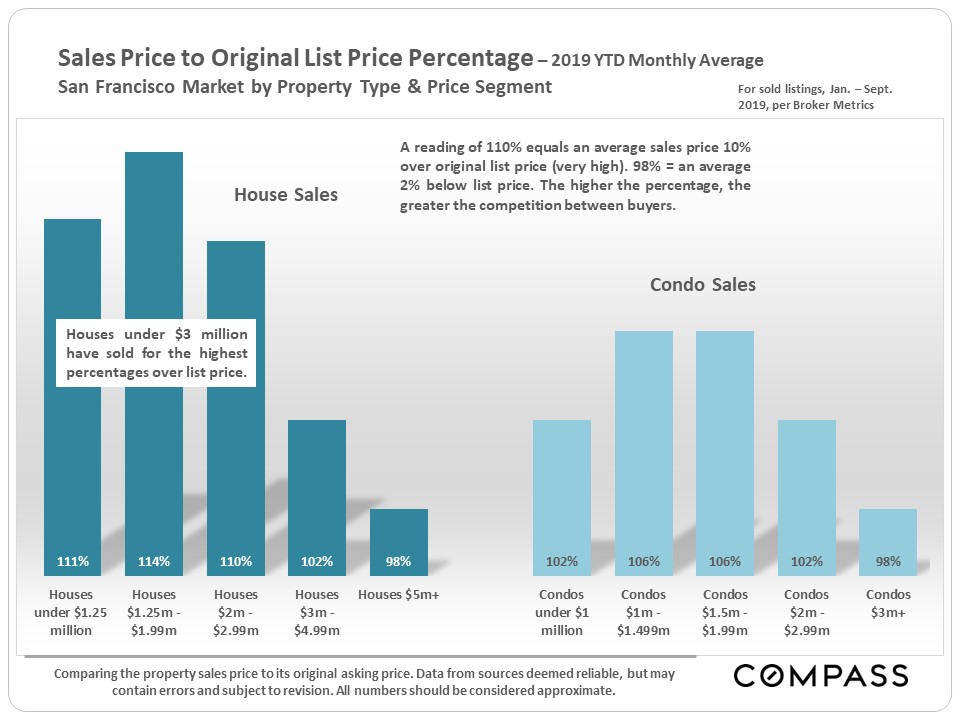
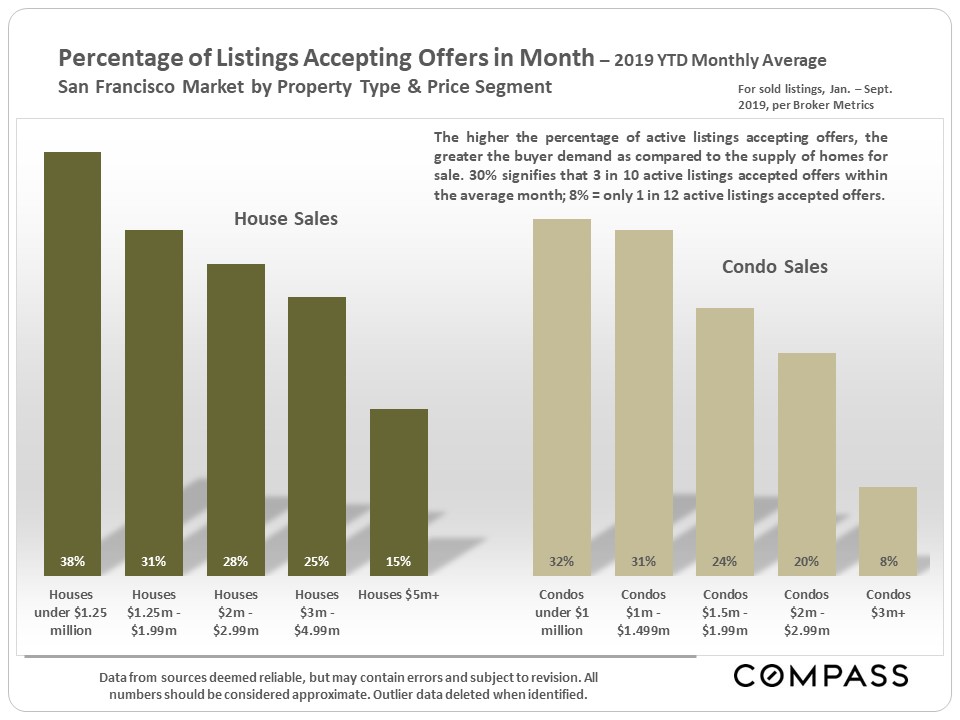
Market Dynamics by Property Type and Price Segment
Location is, of course, always important in real estate value, but to a large degree, market dynamics within San Francisco are also determined by the property type and the price segment. Individual neighborhoods and districts will usually have homes in several, or even all of the price segments, broken out in the three charts below. Each of these segments will see differing supply and demand conditions.
Generally speaking, demand is stronger and supply is lower for houses over condos. For both houses and condos, market dynamics are somewhat softer in the higher price segments, especially above the $3 million price threshold for condos, and in the $5 million+ price segment for houses.
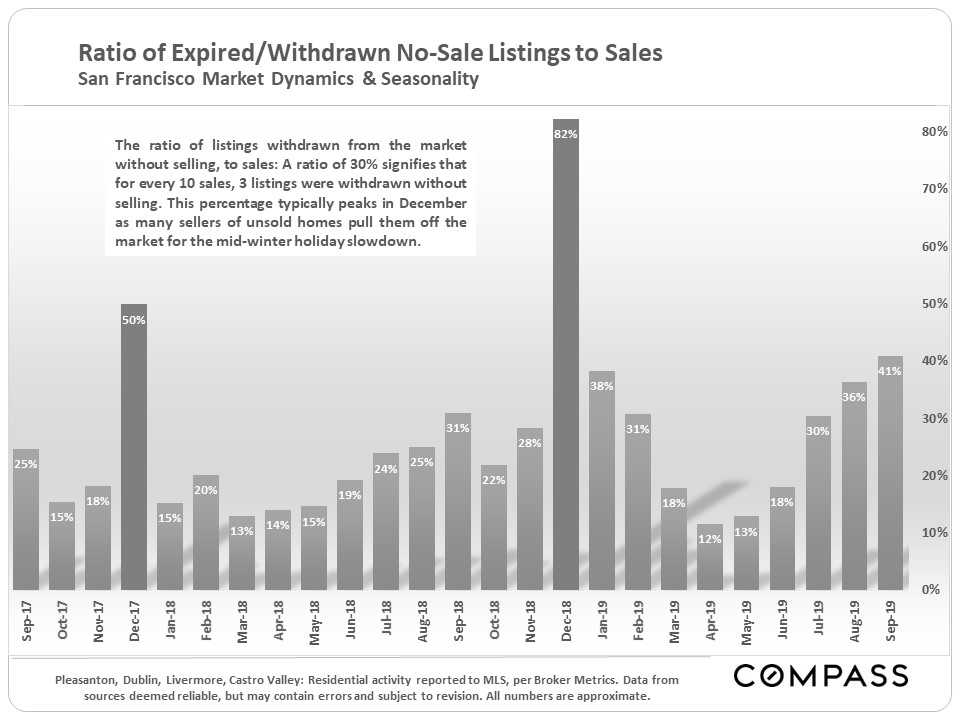
Sales Without Price Reductions & Withdrawn (No-Sale) Listings
The following two charts illustrate both year-over-year changes in market conditions and the role of seasonality within the calendar year.
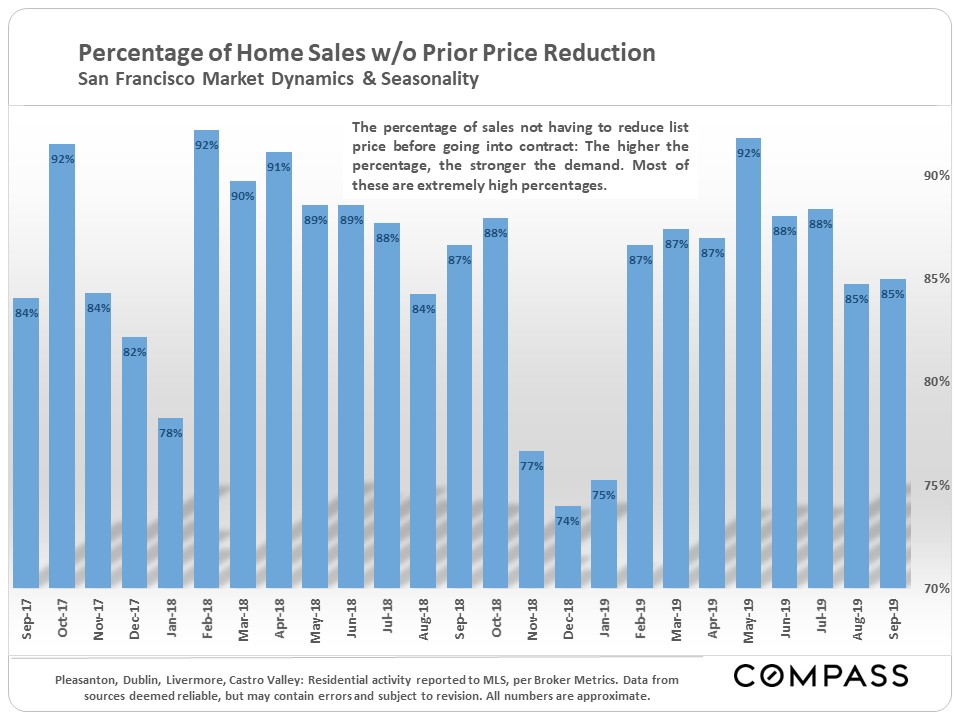
Last year saw a big jump in the number of listings pulled off the market without selling in December—this was a particularly volatile time in financial markets and interest rates were relatively high. The situation with both of those factors has changed dramatically in 2019, but it is too early to see how that will affect the number of listings withdrawn in the last two months of this year.
Source: Compass Bay Area Market Reports
The information herein is based on or derived from information generally available to the public and/or from sources believed to be reliable. No representation or warranty can be given with respect to the accuracy or completeness of the information.