In November the San Francisco real estate market typically starts a big slowdown which runs through the mid-winter holidays, and begins to pick up in mid-January. This year the pandemic upended the usual seasonality: Spring, usually the strongest selling season, saw a crash in activity; summer, which typically slows down saw high demand; and the summer market accelerated into autumn. But supply has been accelerating even faster than demand. Certainly this year has been anything but typical.It’s likely in the final months of 2020 we’ll see a slowdown, but the market may remain more active than in past years.
General Dynamics
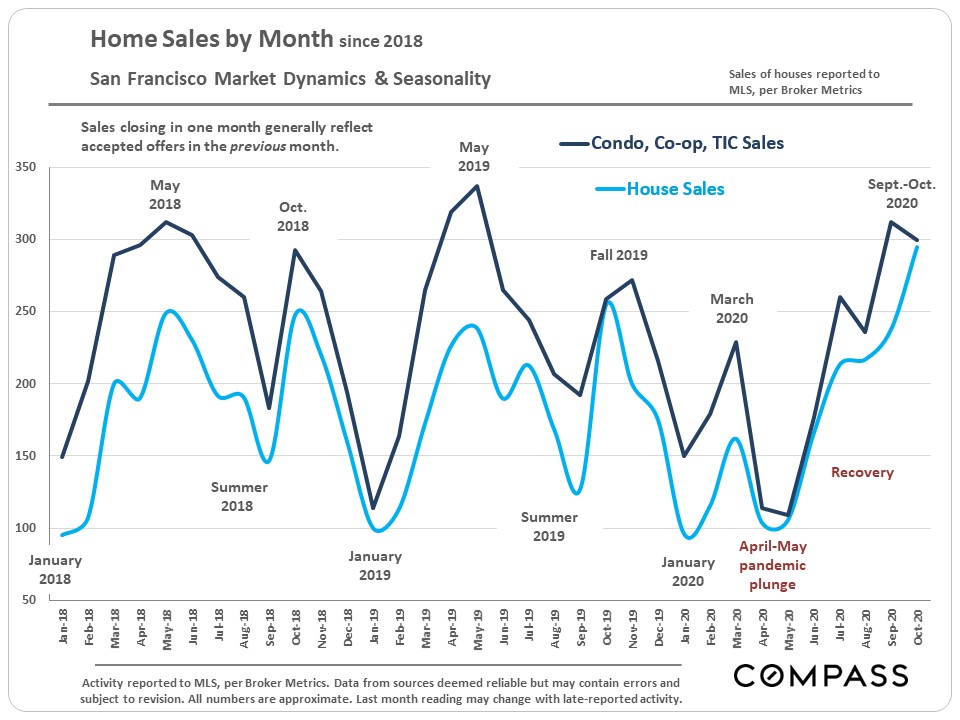
Sales rebounded strongly from the early-spring pandemic crash: House sales are higher than in recent years and condo, co-op and TIC sales are at levels comparable to peak sales volumes over that period.
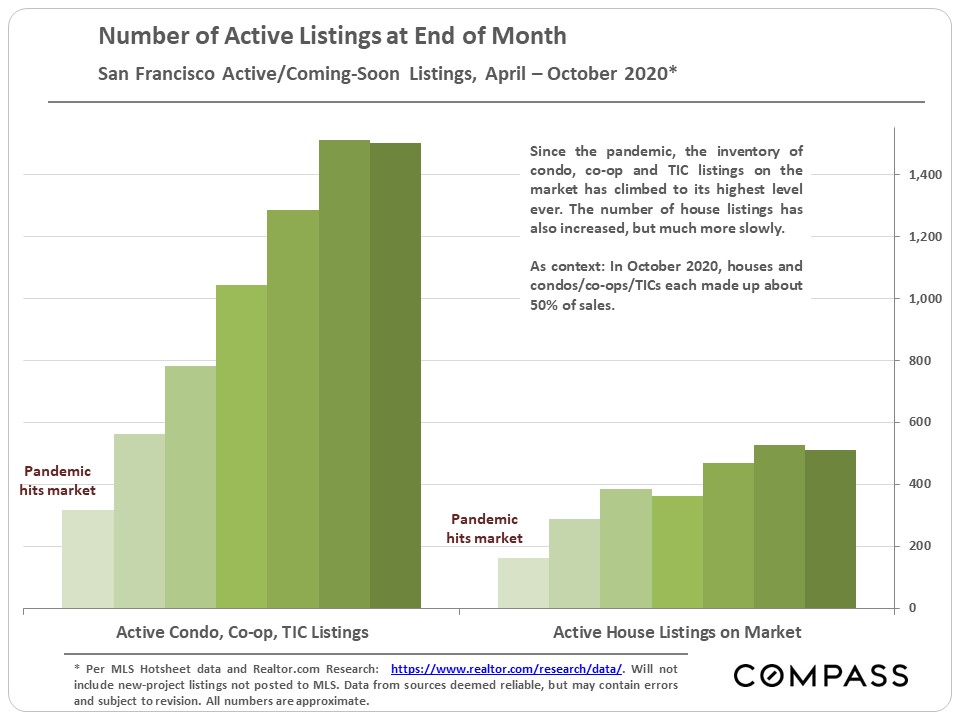
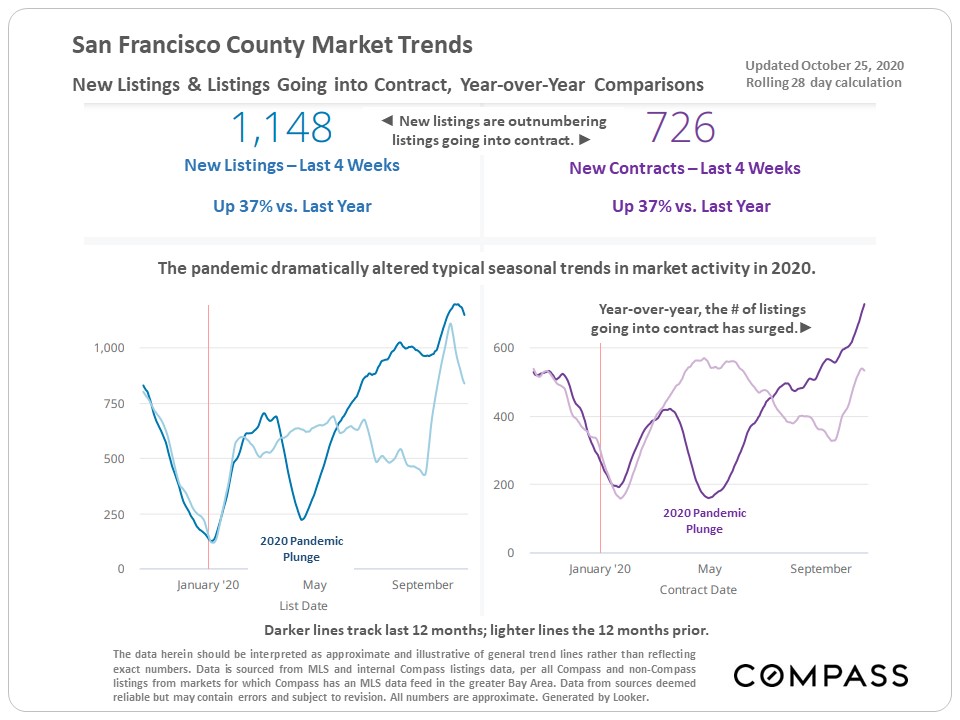
The most dramatic change is the increase in the number of listings for sale. Overall, new listings are outnumbering listings going into contract. Condo, co-op and TIC listings in MLS are at their highest point ever, approximately 85% higher than one year ago. House listings are also up, but much less dramatically, running about 20% to 25% higher than in autumn 2019.
Steady demand but soaring inventory has led to an increase in price reductions. When demand outweighs supply, buyers compete for listings, usually by overbidding. When supply outweighs demand, sellers often compete for buyers through price reductions. The condo market has been particularly impacted by price reductions.
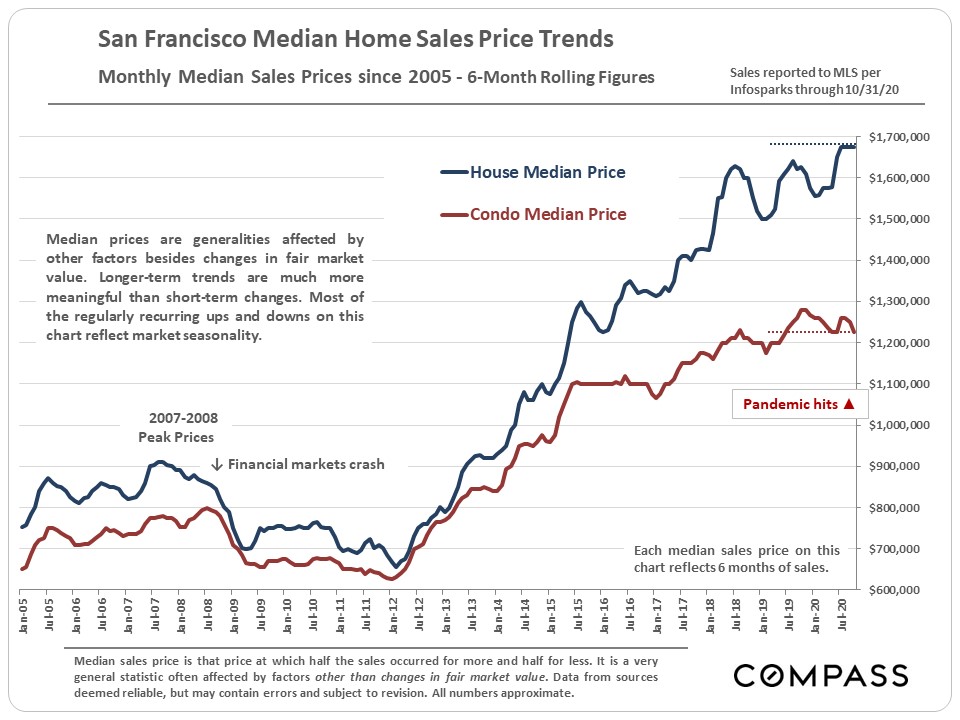
Long-Term Median Sales Price Trends
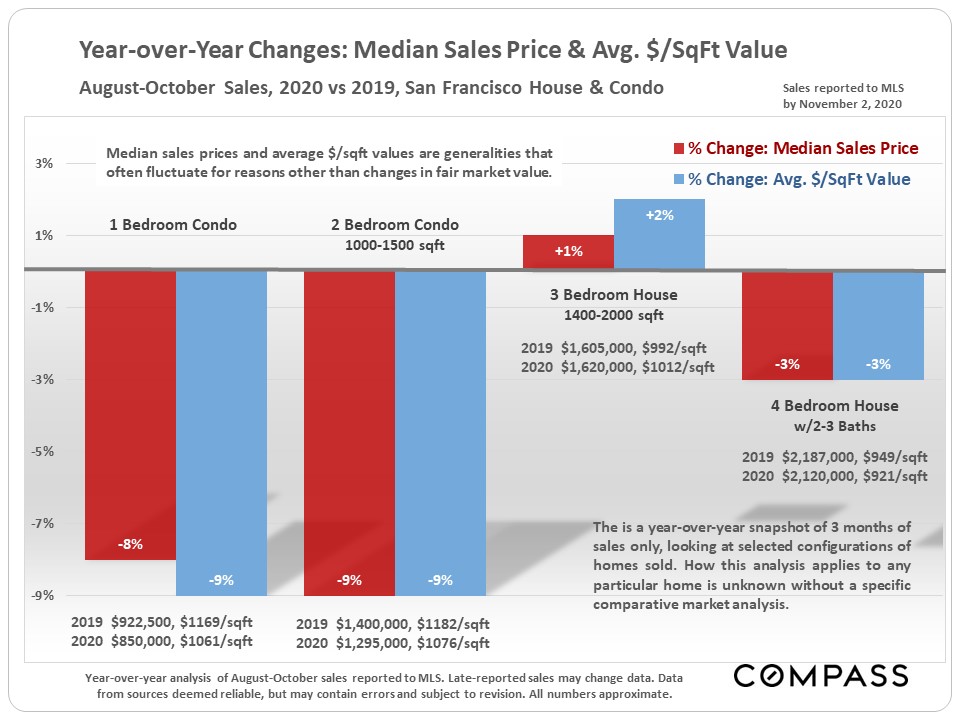
The chart below shows year-over-year changes in median sales prices and average dollar per square foot values in a few different home configurations. The condo market has been hit by significant declines in these two measurements.
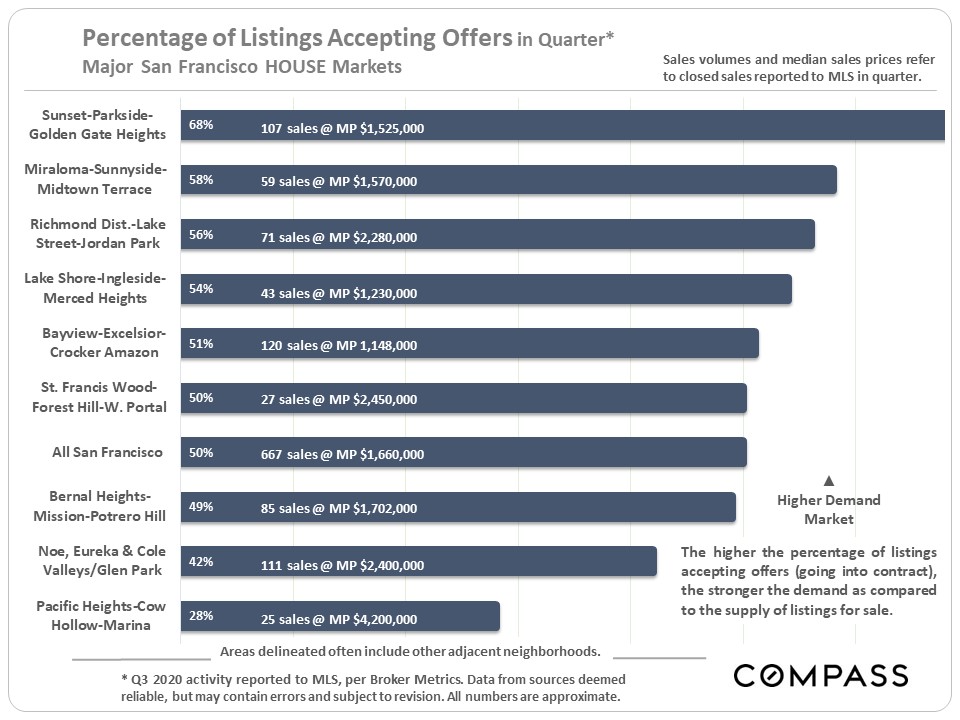
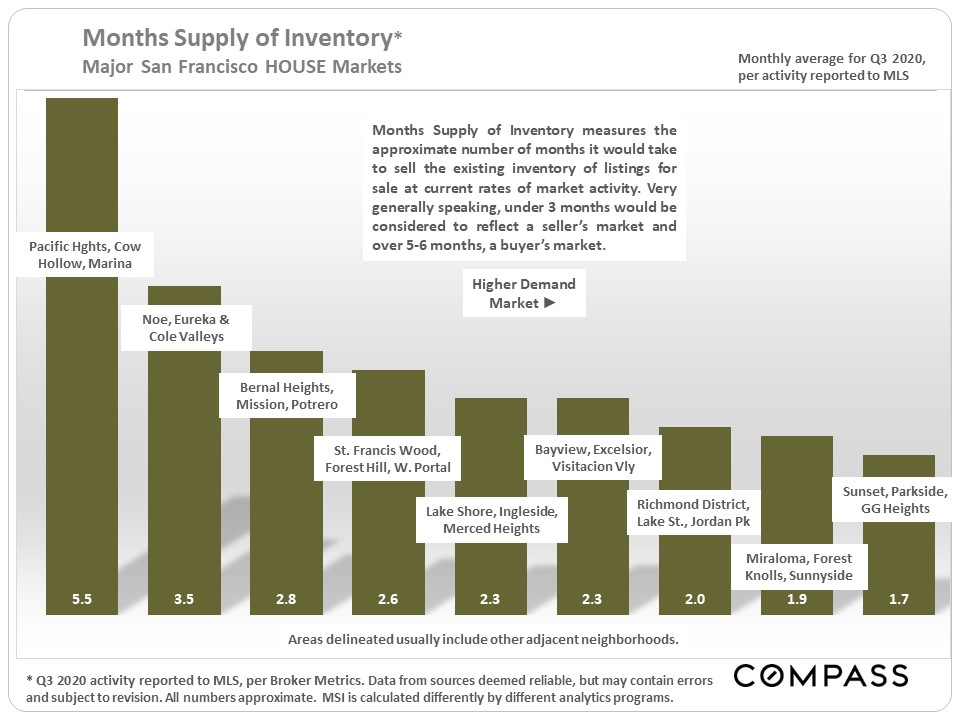
House Markets by District/Neighborhood
Within the city, there are significant differences in market dynamics by location. By most standard measurements, the greater Sunset/Parkside district has the strongest house market in the city, with house values just below the SF median house price. At the softer end of dynamics are two of the city’s most expensive districts, which feature the largest luxury house segments.
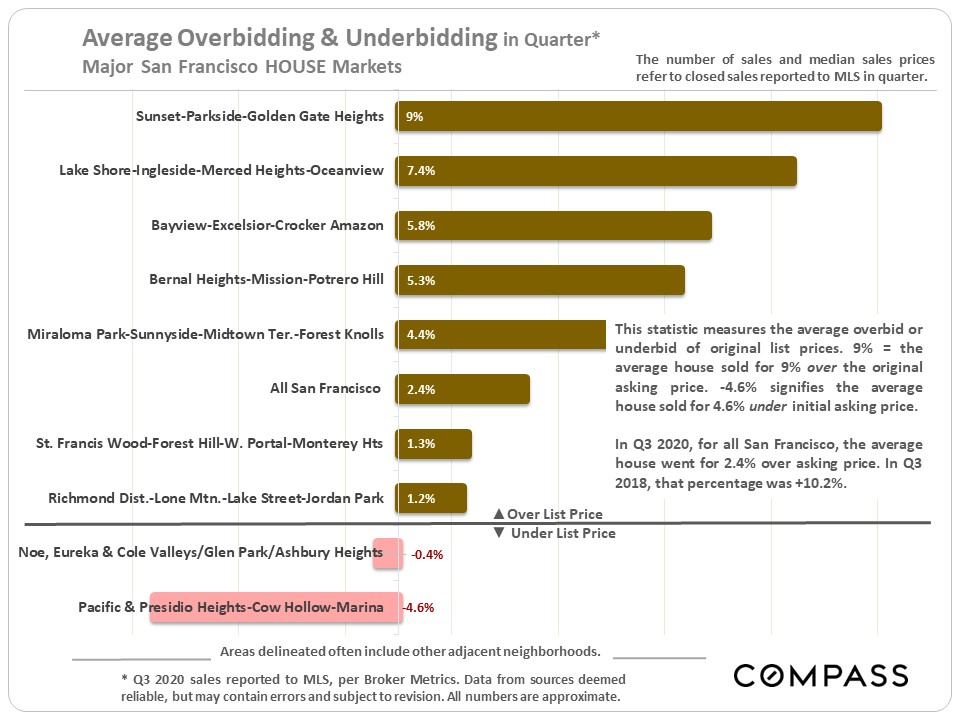
Overbidding on house listings is well down from the higher levels seen in recent years, but is still relatively common in more affordable districts. Some part of the overbidding percentages is caused by strategic underpricing of listings (a pricing tactic sometimes used to generate more buyer interest).
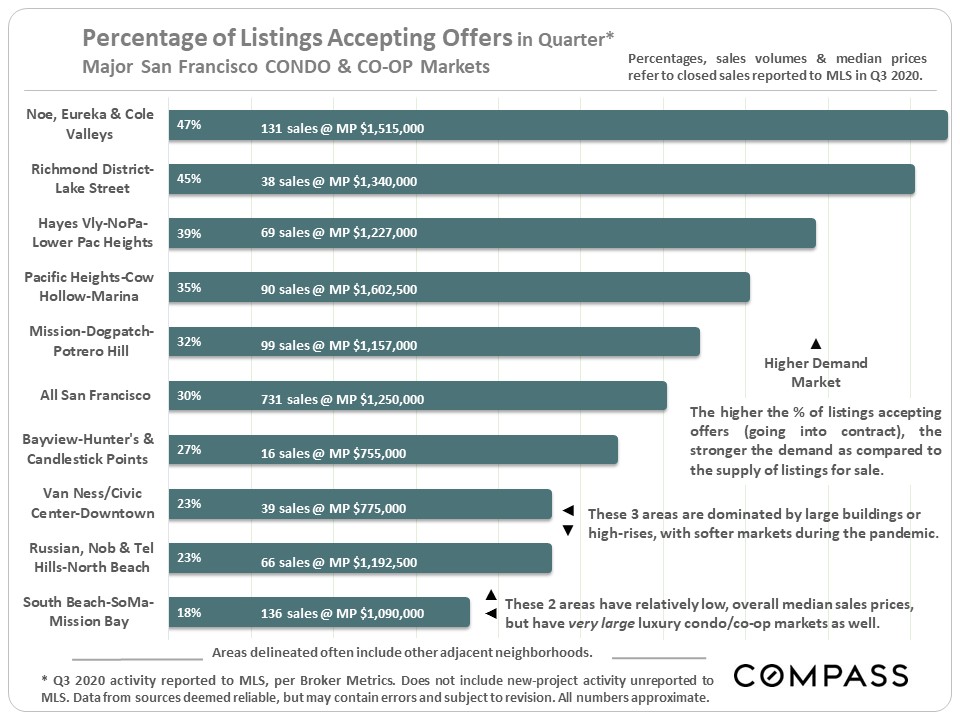
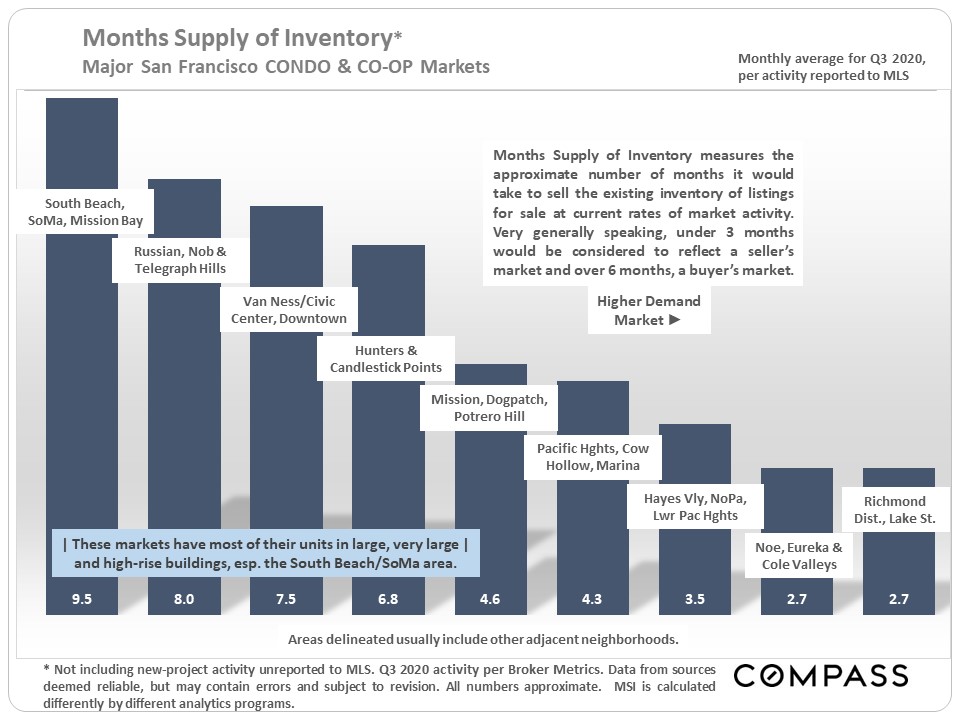
San Francisco Condo Markets by District/Neighborhood
Since the pandemic hit, the softest condo markets have been those dominated by larger complexes and high-rises. The greater South Beach/ SoMa/ Mission Bay area – by far the largest condo market in SF – has the weakest supply and demand dynamic, followed by the greater Russian, Nob and Telegraph Hills area, and the Van Ness/Civic Center area.
Markets dominated by smaller buildings, often with separate unit entrances and dedicated outdoor spaces, have seen stronger buyer demand.
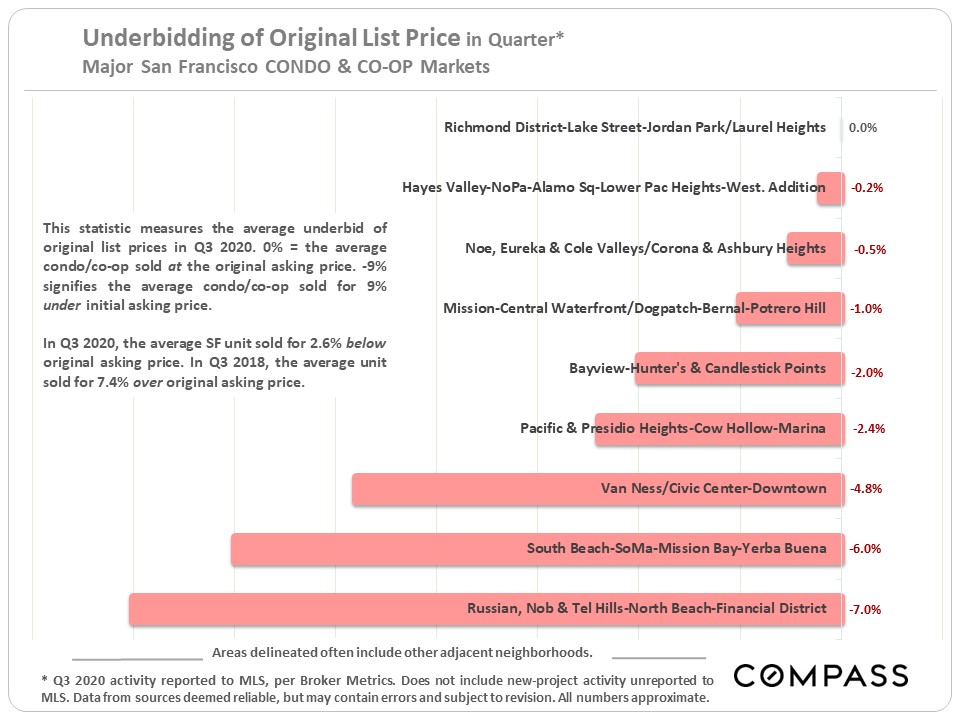
As a statistical average, overbidding above the original list price has disappeared from the condo market. This ties in with the previous chart on price reductions.
The information herein is based on or derived from information generally available to the public and/or from sources believed to be reliable. No representation or warranty can be given with respect to the accuracy or completeness of the information.