After a brief rebound in market activity in August, macroeconomic conditions shifted with interest rates climbing to a 20-year high, which impacted the fall market. Last month, San Francisco saw the lowest number of October home sales since 2011.
This period of adjustment in the housing market and economy is causing many people to be more cautious while they wait to see how things will play out. While homes continue to sell and a significant portion are still selling quickly and over list price, that proportion is declining. New listings coming on the market is down year-over-year and a higher percentage of listings than normal are being removed from the market. We’ll likely see these listings return to the market in the spring.
Recent news about inflation data being lower than anticipated may result in the Federal Reserve slowing down on increasing interest rates, which could help to lower interest rates in 2023. On November 10, the average rate on the 30-year fixed dropped 60 basis points from 7.22% to 6.62%, according to Mortgage News Daily. This is equal to the record drop at the start of the Covid 19 pandemic.
The market is now entering the two-month holiday period, which typically sees the year’s lowest levels of activity.
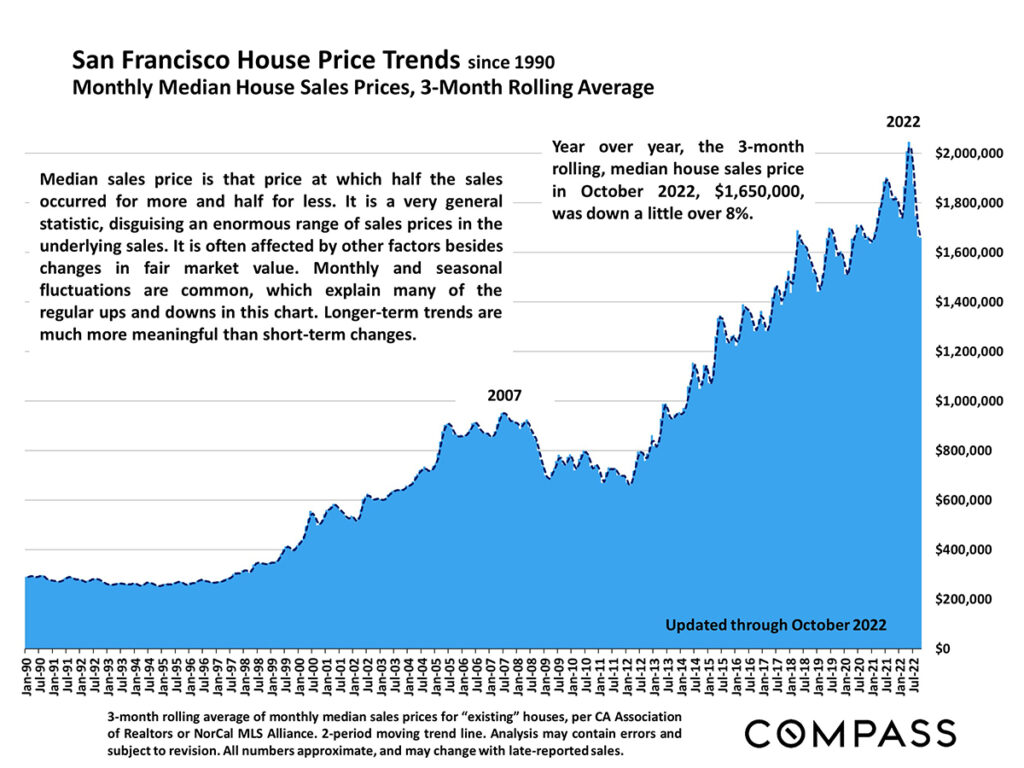
House Price Trends
Year-over-year, the median house sales price in October of this year was down a little over 8%.
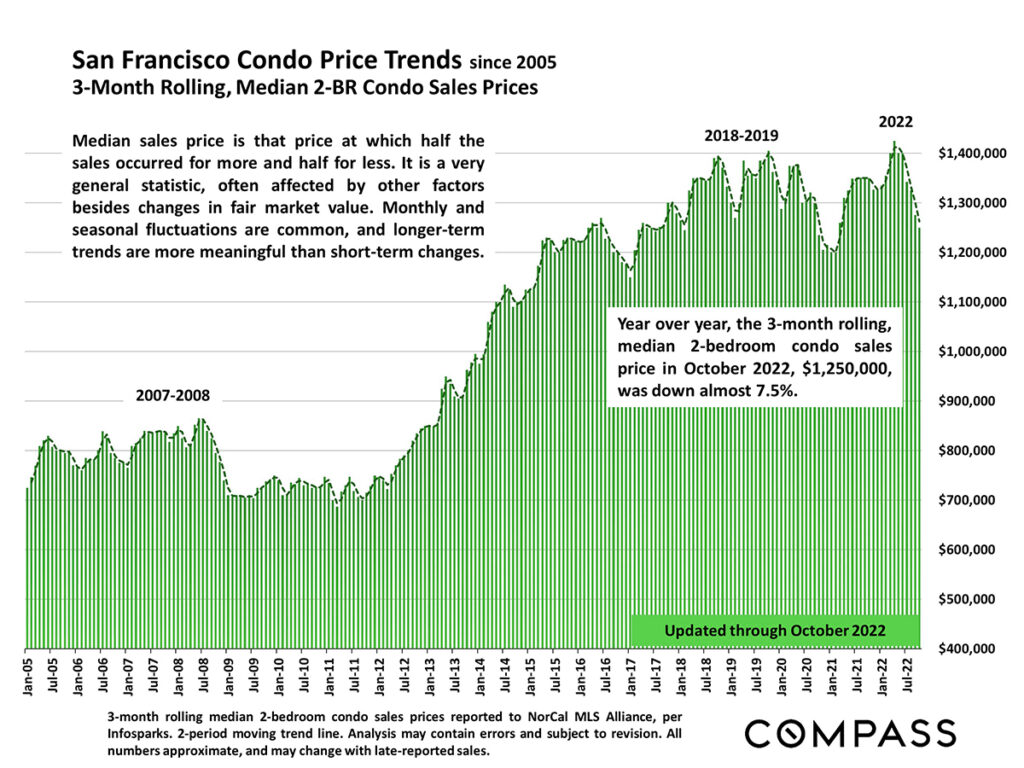
Condo Price Trends
Year-over-year, the median 2-bedroom condo sales price in October of this year was down almost 7.5%.
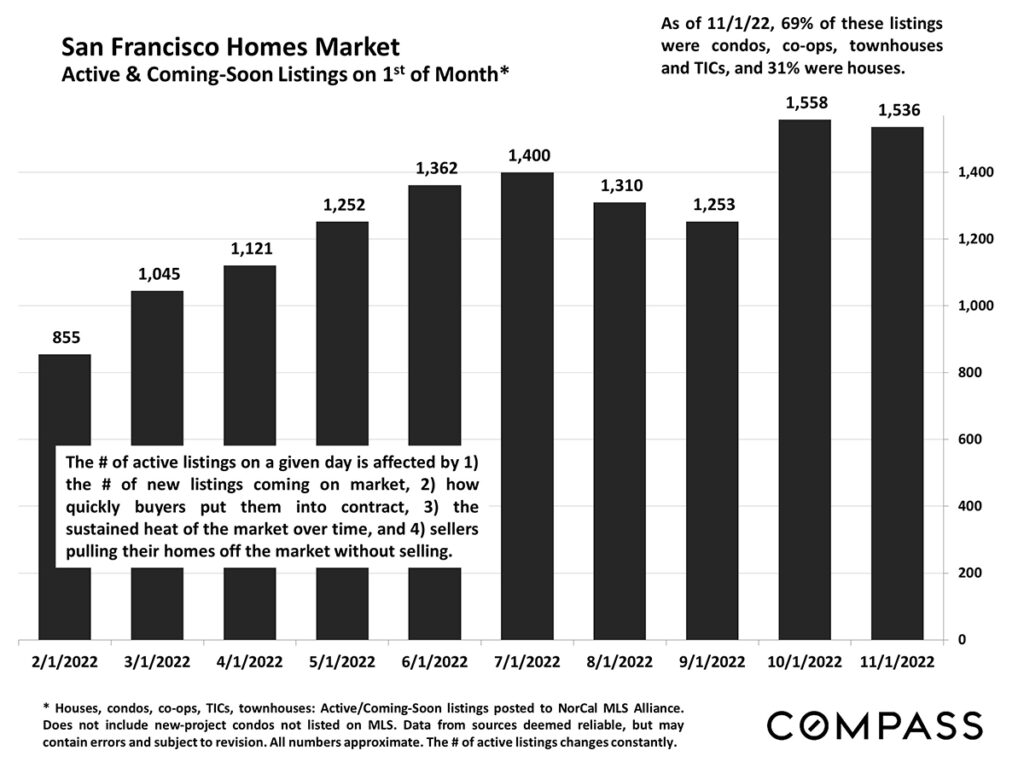
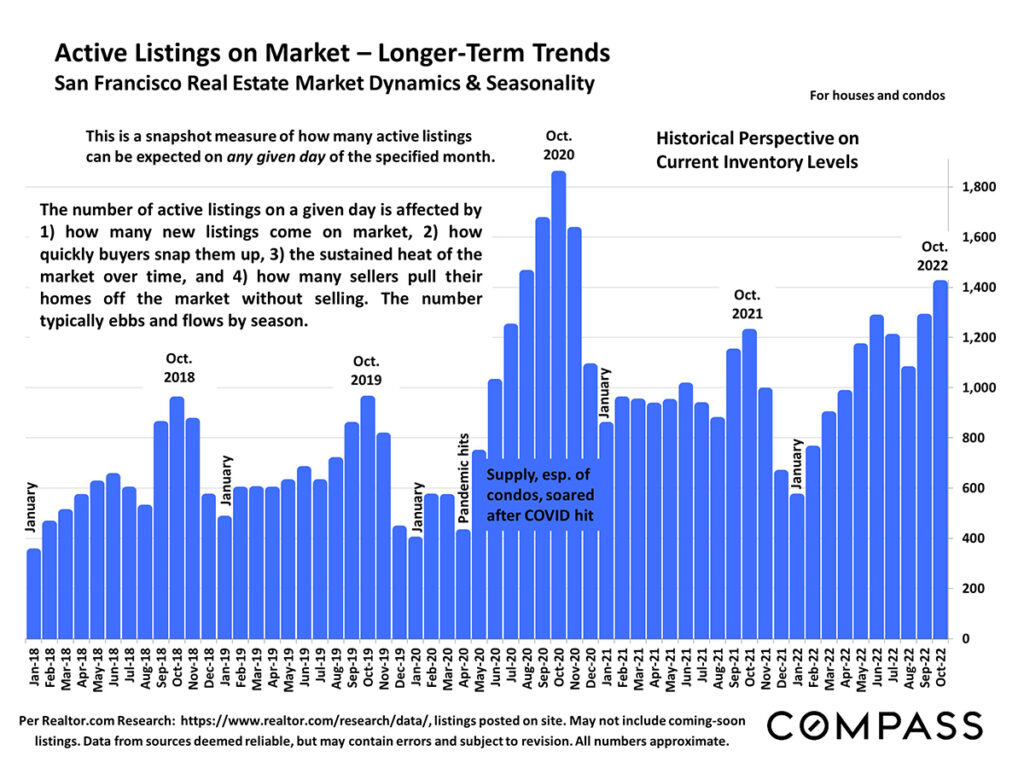
Active Listings
As of November 1, 69% of active or coming soon listings on the market were condos, co-ops, townhouses and TICs, and 31% were houses.
Looking at longer term trends, this year, the fall market was higher than last year, as well as levels in 2018 and 2019, but lower than 2020 when the supply of condos early in the pandemic had a huge impact on inventory levels.
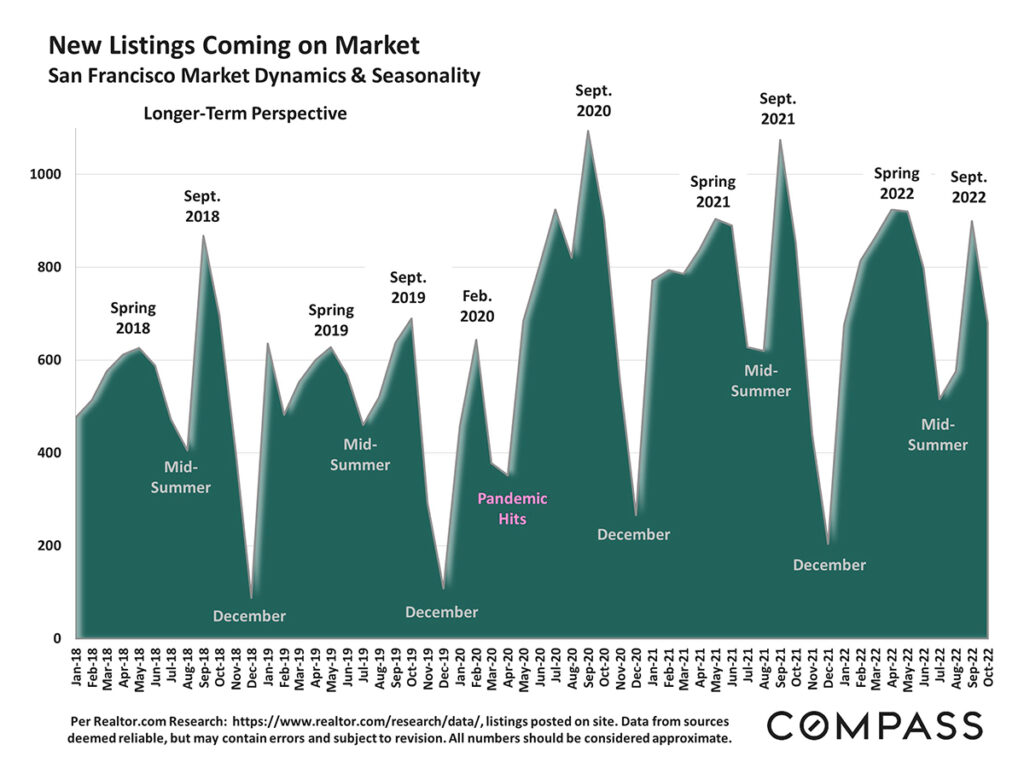
New Listings Coming on Market
New listings in the fall market this year were down from the highs of 2020 and 2021, above 2019, but comparable to 2018.
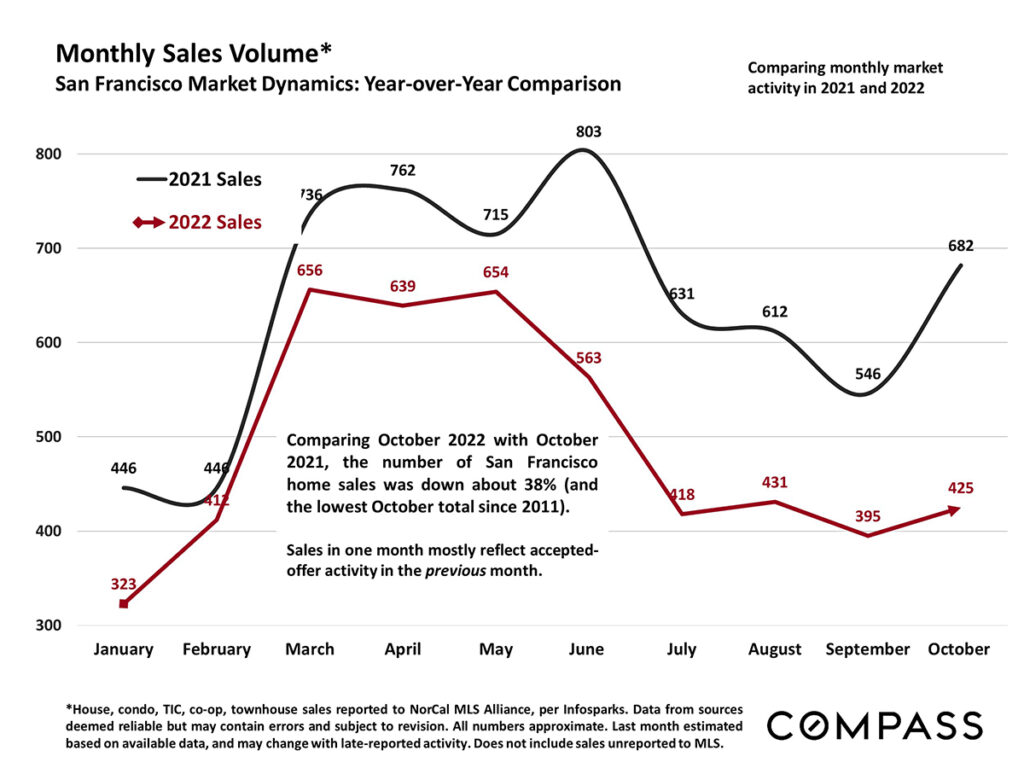
Monthly Sales Volume
Monthly sales volume in October was considerably lower than last year, following the trend line for the entirety of 2022.
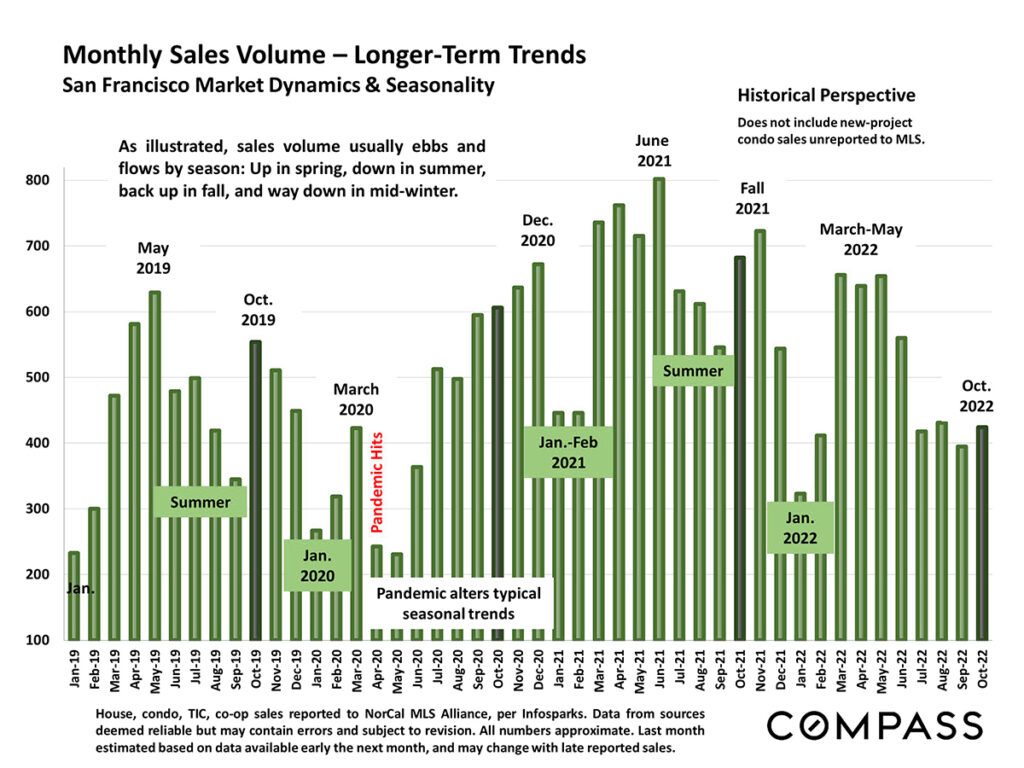
Monthly Sales Volume - Longer-Term Trends
Looking at longer-term trends, sales volume in October this year was lower than the past three years.
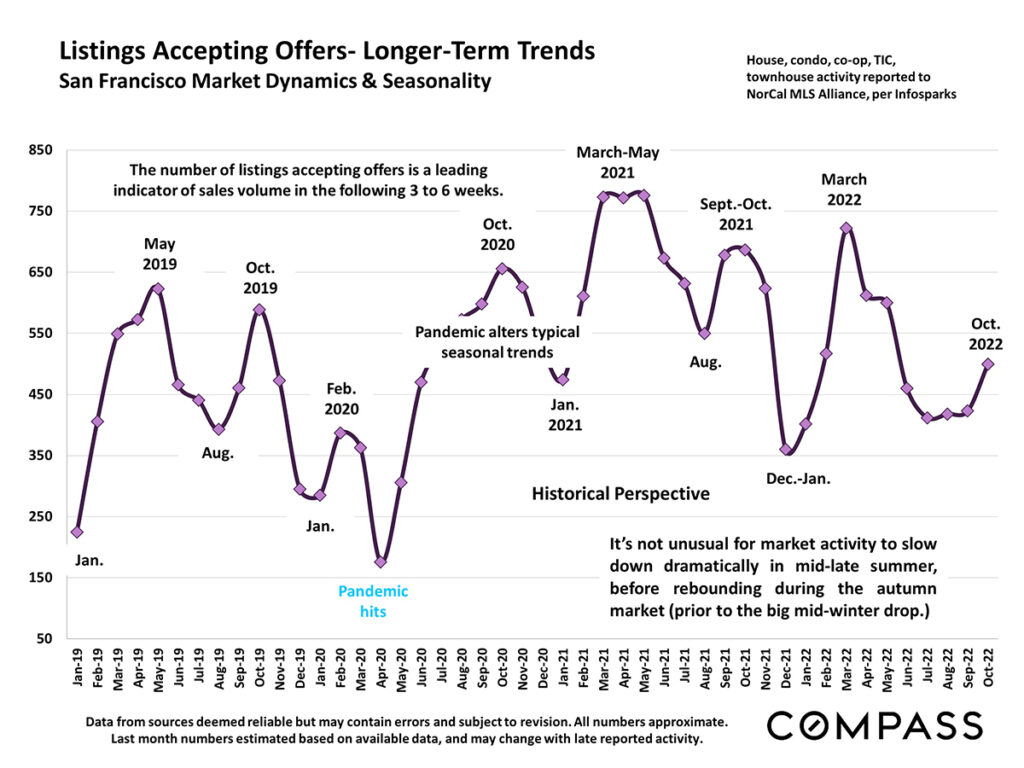
Listings Accepting Offers
Additionally, the number of listings accepting offers was also lower this October than the previous few years.
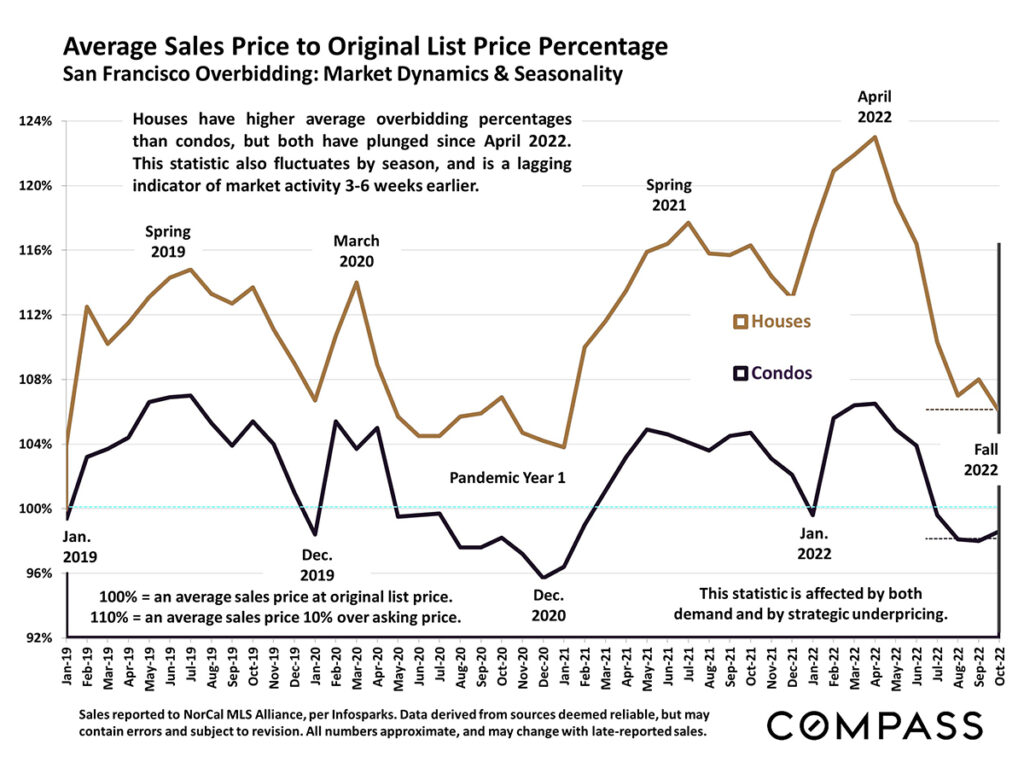
Average Sales Price to List Price
While the average overbidding percentages are higher for houses than condos, both have dropped since the spring market. This statistic an be impacted by demand, as well as strategic underpricing.
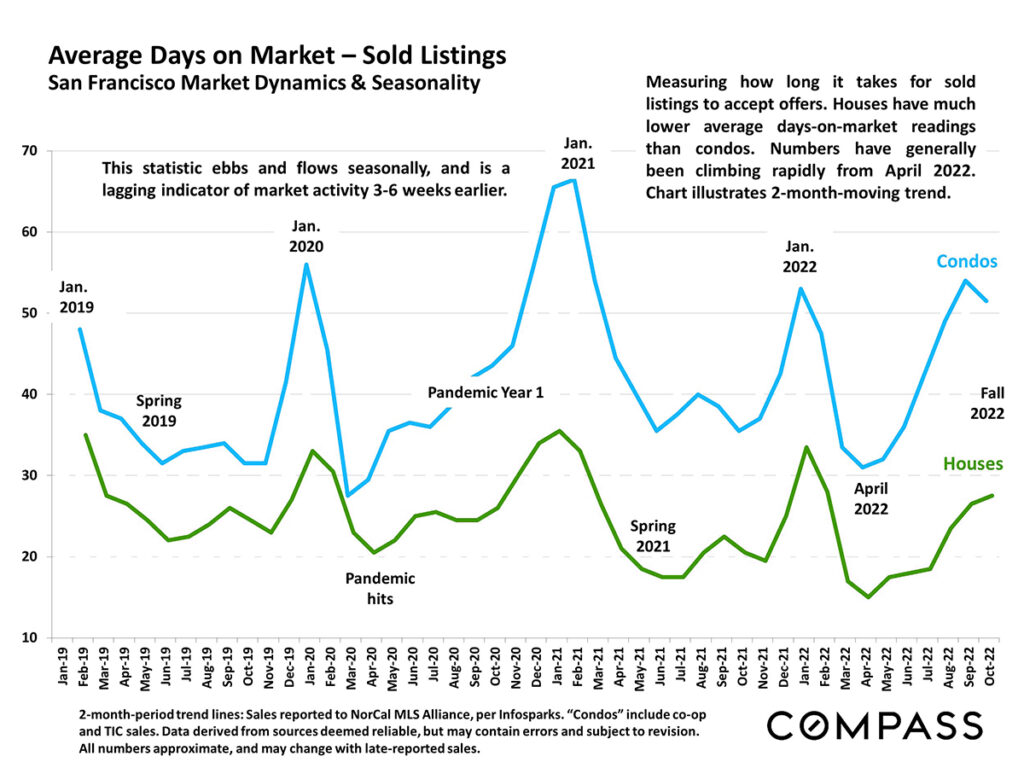
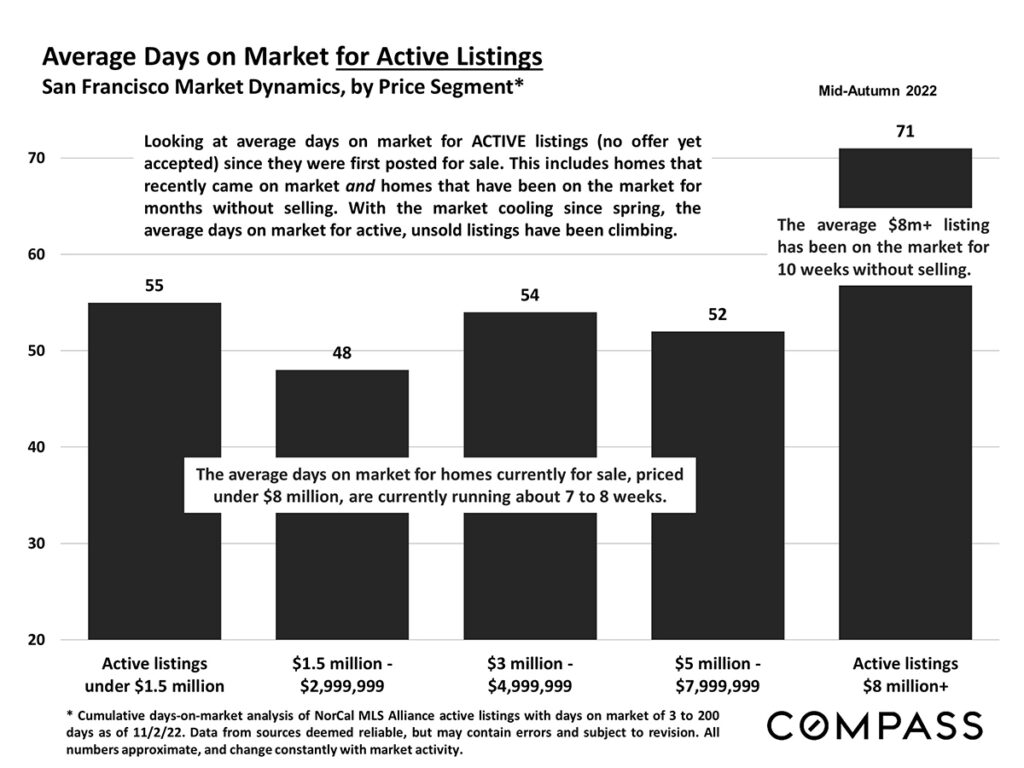
Average Days on Market
Average days of market continues to be lower for houses than condos, but days on market have increased for both since the spring.
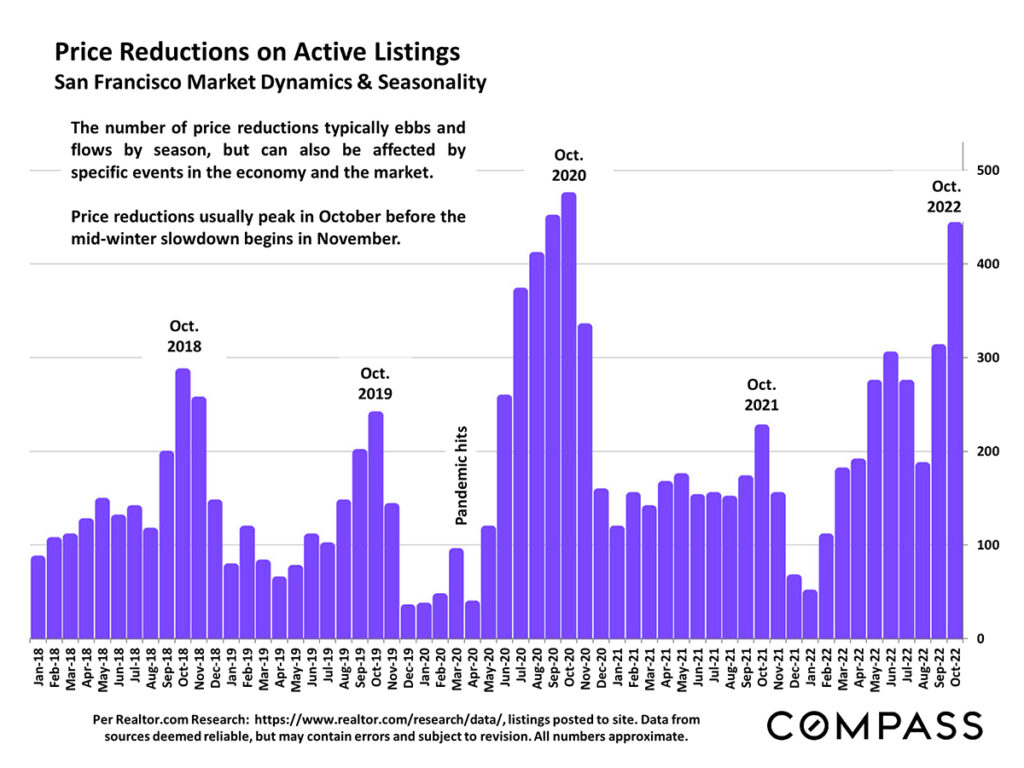
Price Reductions on Active Listings
Price reductions typically peak in October before the November/December winter slowdown, and this year was no exception. Price reductions in October of this year were similar to those in 2020.
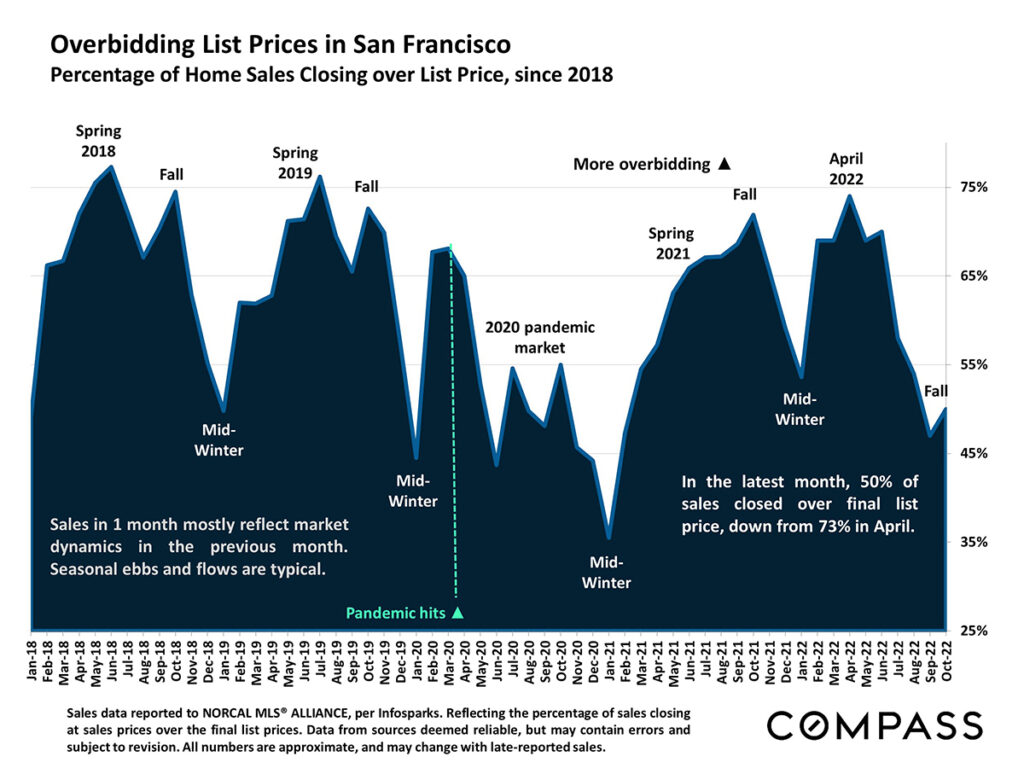
Overbidding of List Prices
In October of this year, 50% of sales closed over the list price, down from 73% in April.
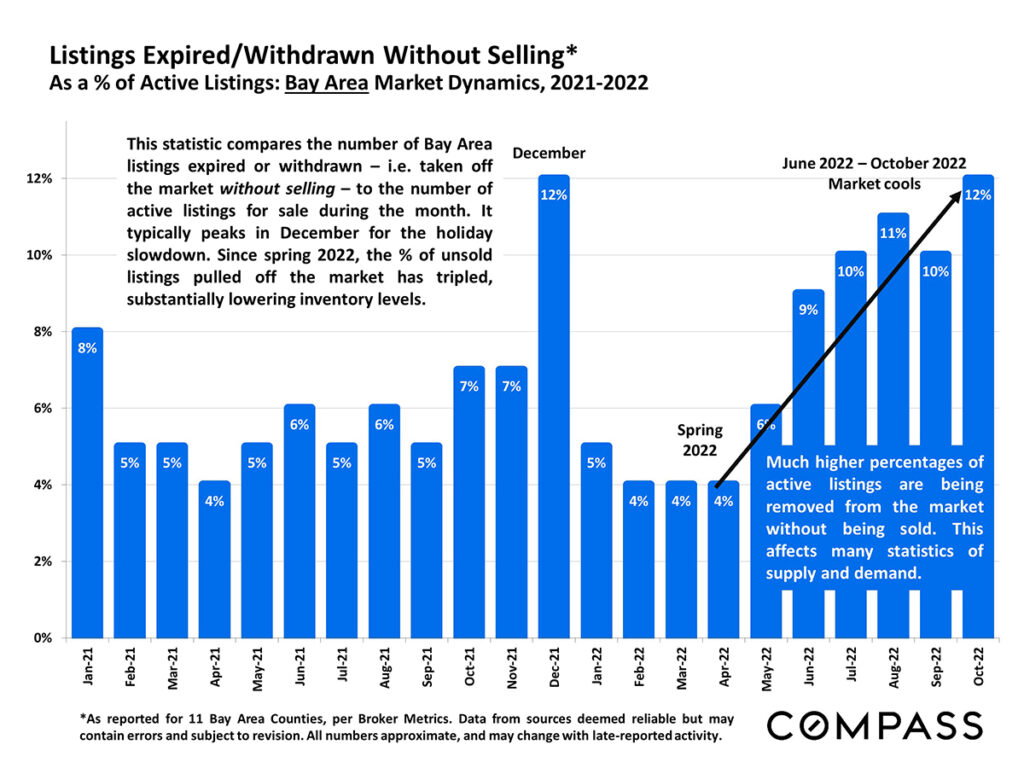
Expired/Withdrawn Listings
Since spring of this year, the percentage of unsold listings pulled off of the market has tripled, substantially lowering inventory levels as the market cools.
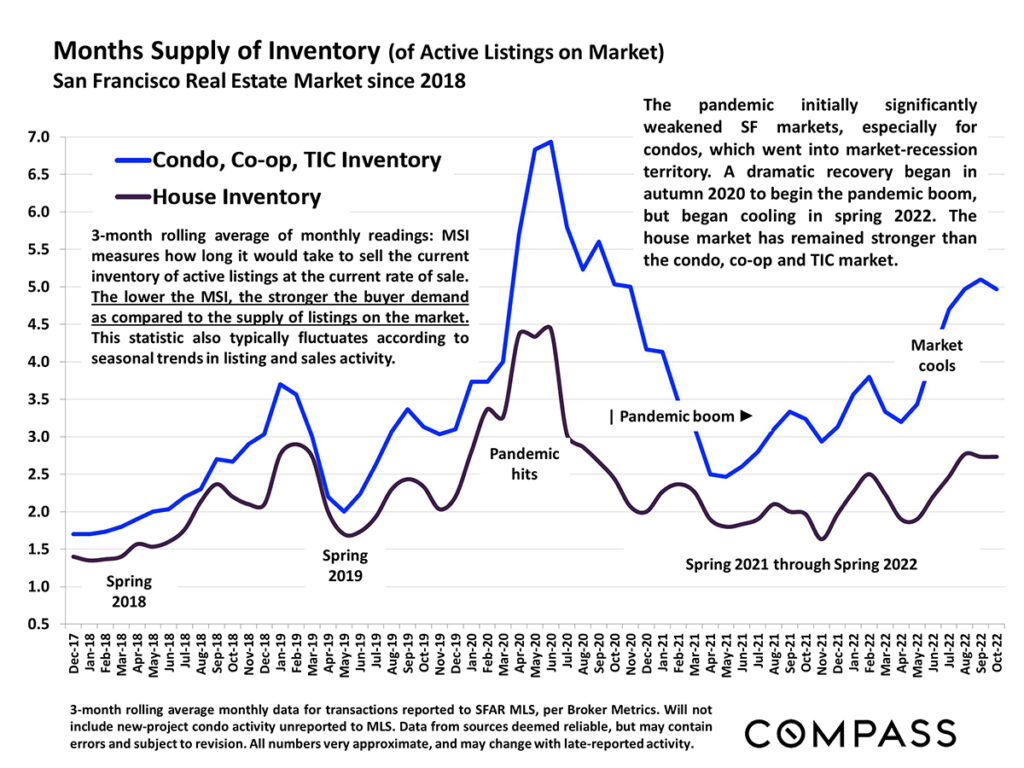
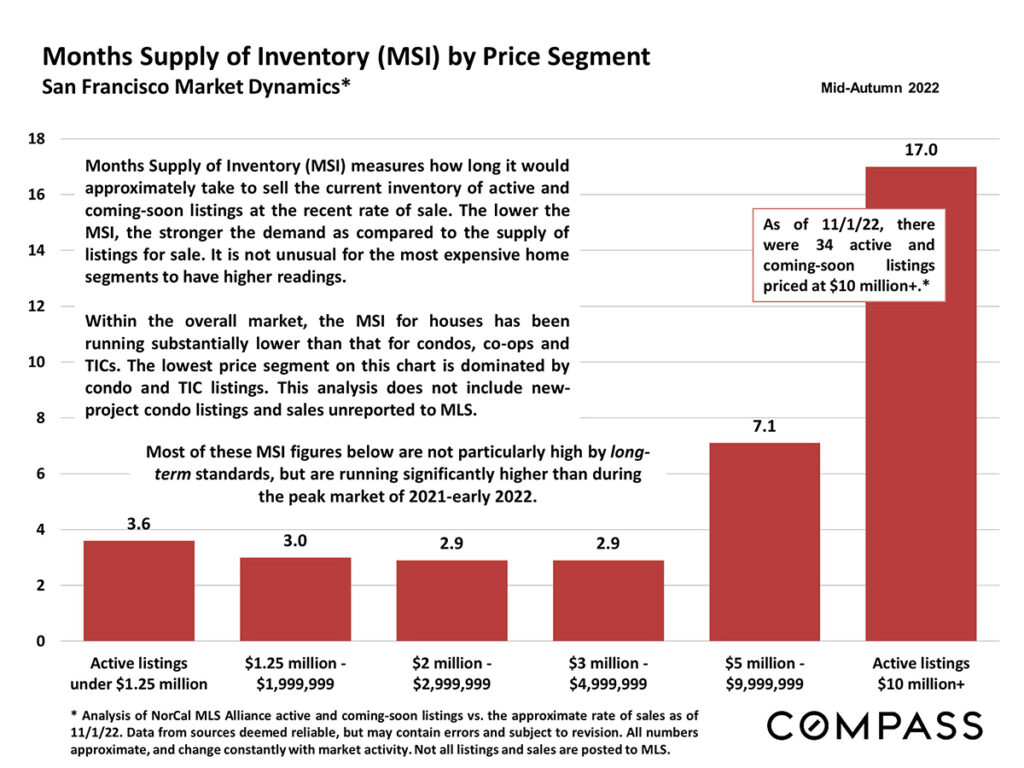
Months Supply of Inventory
Months supply of inventory (MSI) indicates how long it would take to sell the current inventory of active listings at the current sales rate in the market. The lower the MSI, the stronger the buyer demand compared to the available listings.
Looking at MSI by price segment, the lowest price segment on the chart below is largely condo and TIC listings. While these MSI figures are not high by long-term standards, they are running higher than during the peak of the market in 2021 and early 2022.
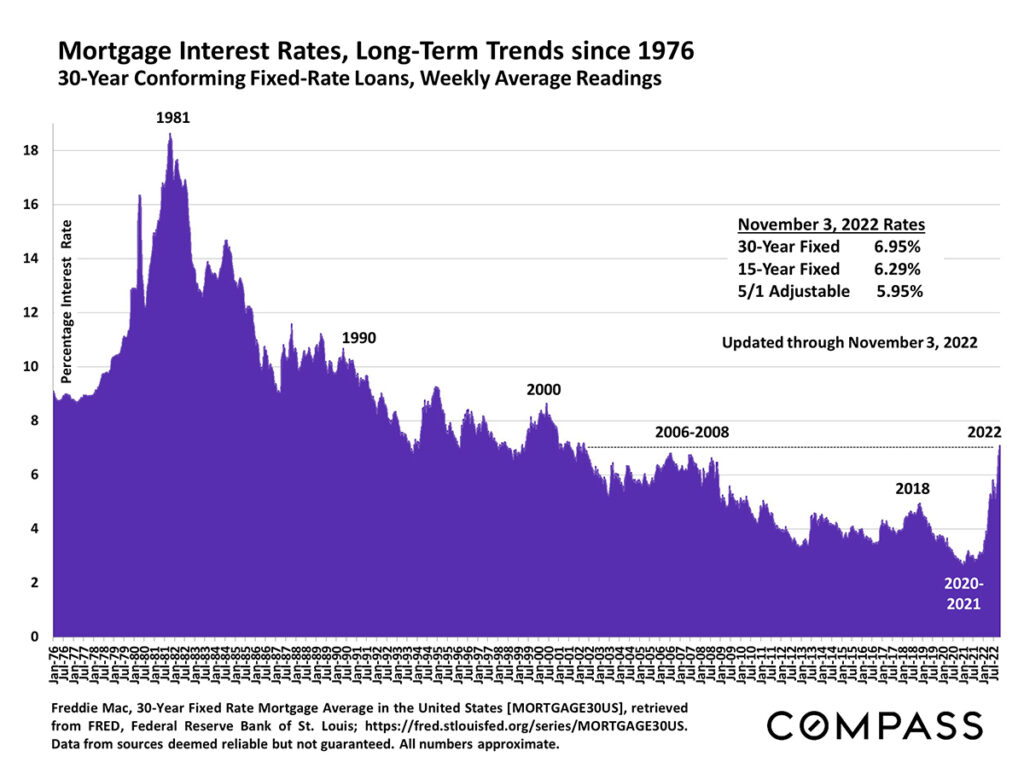
Mortgage Interest Rate Trends
Mortgage interest rates are currently just below 7%.
The information herein is based on or derived from information generally available to the public and/or from sources believed to be reliable. No representation or warranty can be given with respect to the accuracy or completeness of the information.