August is typically one of the slowest times of year in the market. With the Fed announcing a benchmark rate cut of a half-point on September 18, things are trending in a positive direction. While early September is the start of the busier fall season, there may be a significant increase in demand if rates decline further. Mortgage rates recently dropped to their lowest levels (6.15%) since September 2022.
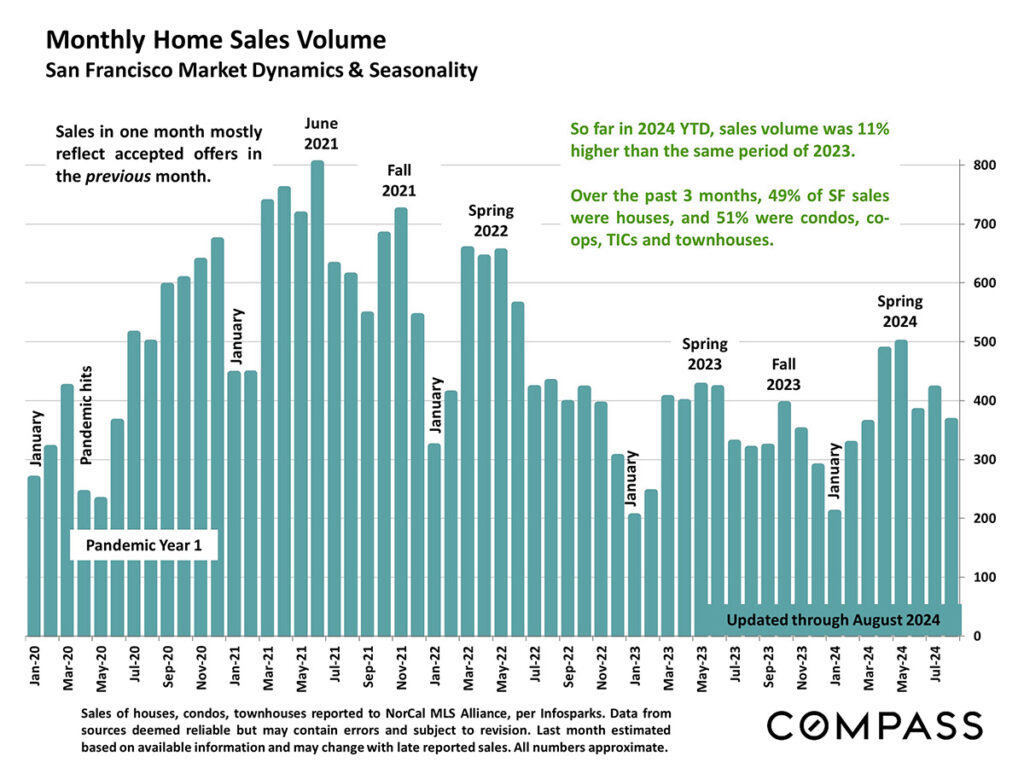
Home Sales Volume
Year to date, sales volume was 11% higher than the same period in 2023. In the past three months, 49% of San Francisco sales were houses and 51% were condos, co-ops, TICs, and townhouses.
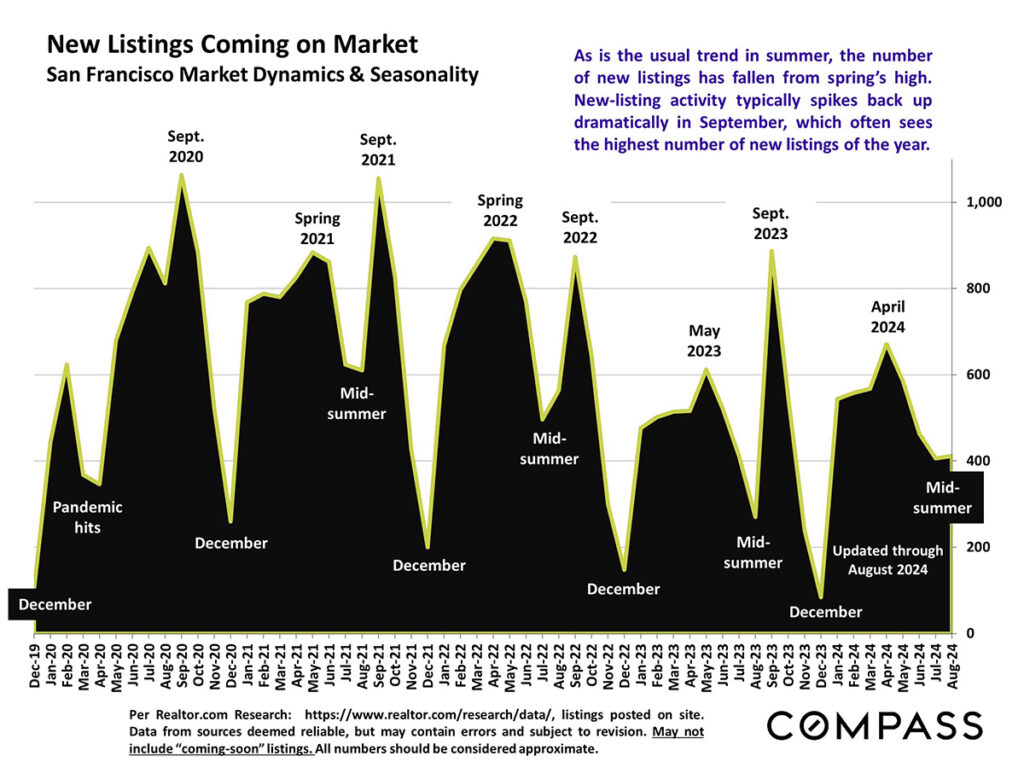
New Listings
As is typical during the summer months, the number of new listings drops from the busy spring season. We typically see new listings increase in the fall.
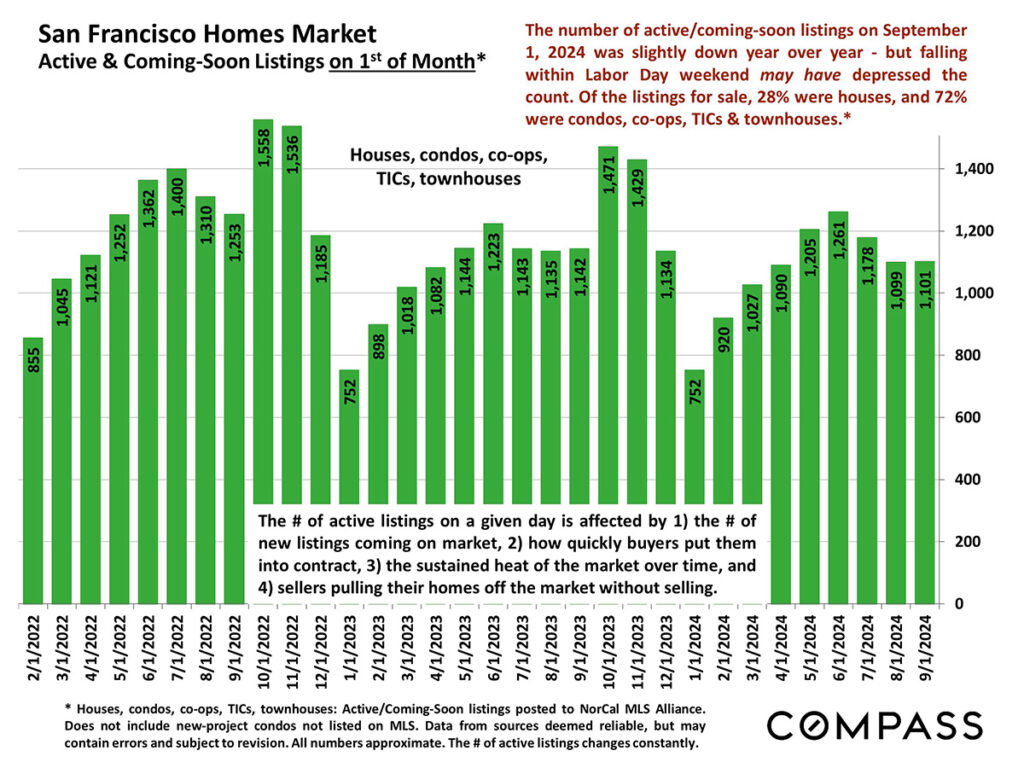
Active and Coming Soon Listings
The number of active and coming soon listings on September 1 was down slightly compared to 2023 (although September 1 this year was on the Labor Day weekend). Of the listings for sale 72% were condos, co-ops, TICs, and townhouses, and 28% were houses.
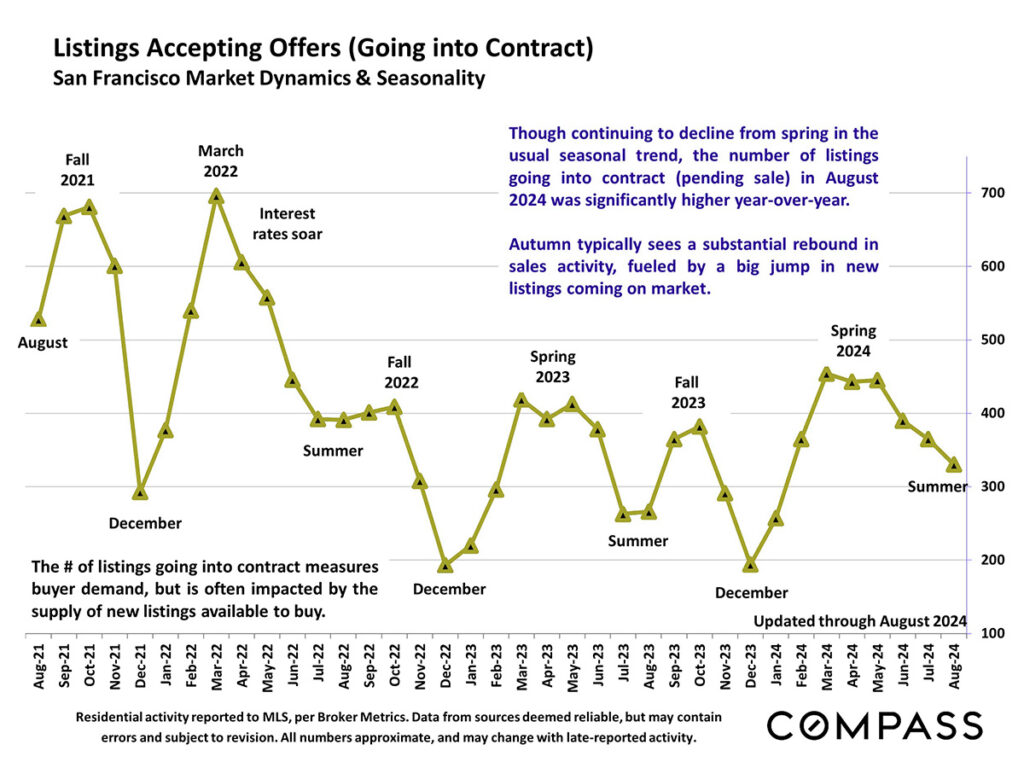
Listings Accepting Offers
The number of pending listings in August 2024 was higher compared to last year.
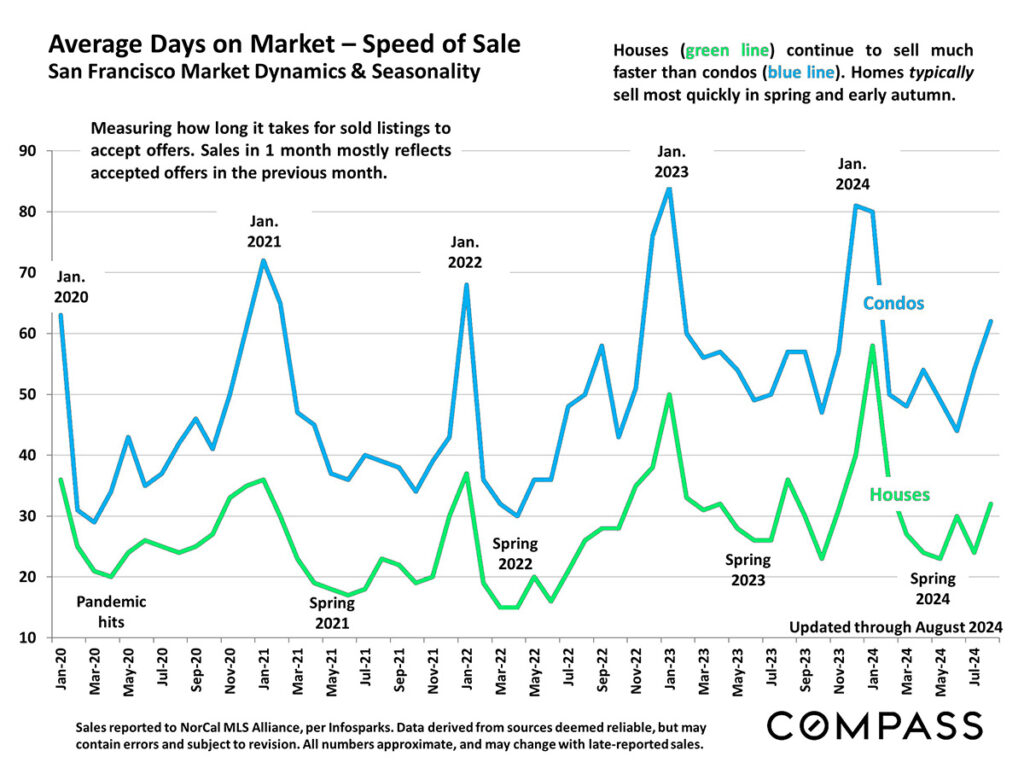
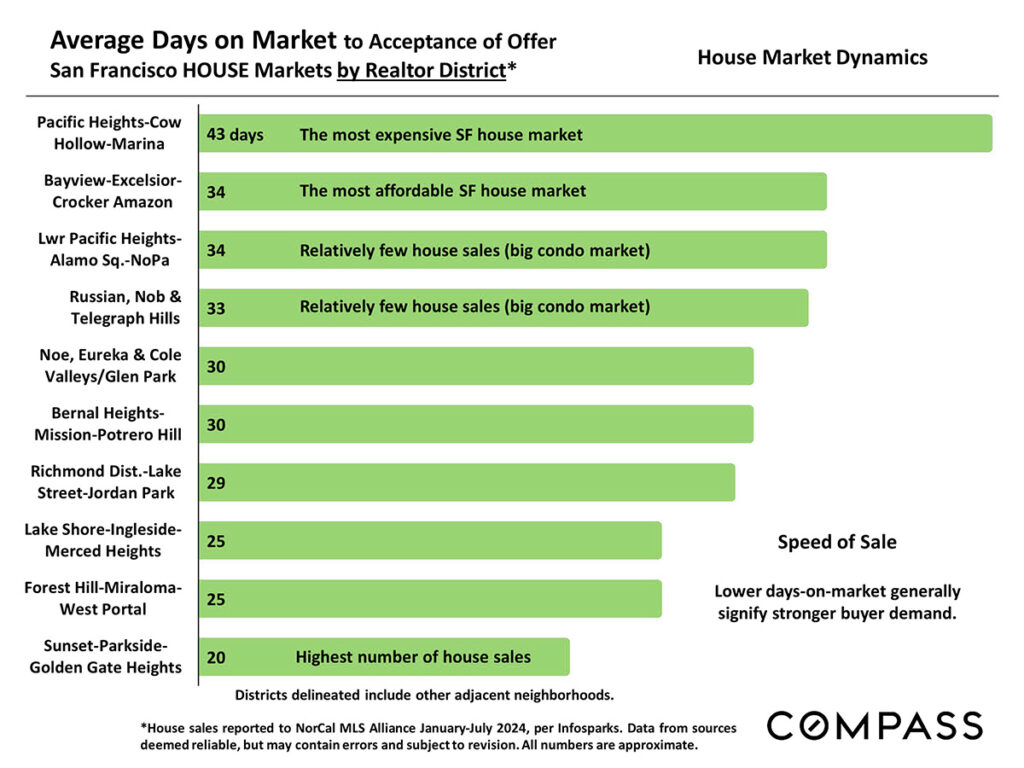
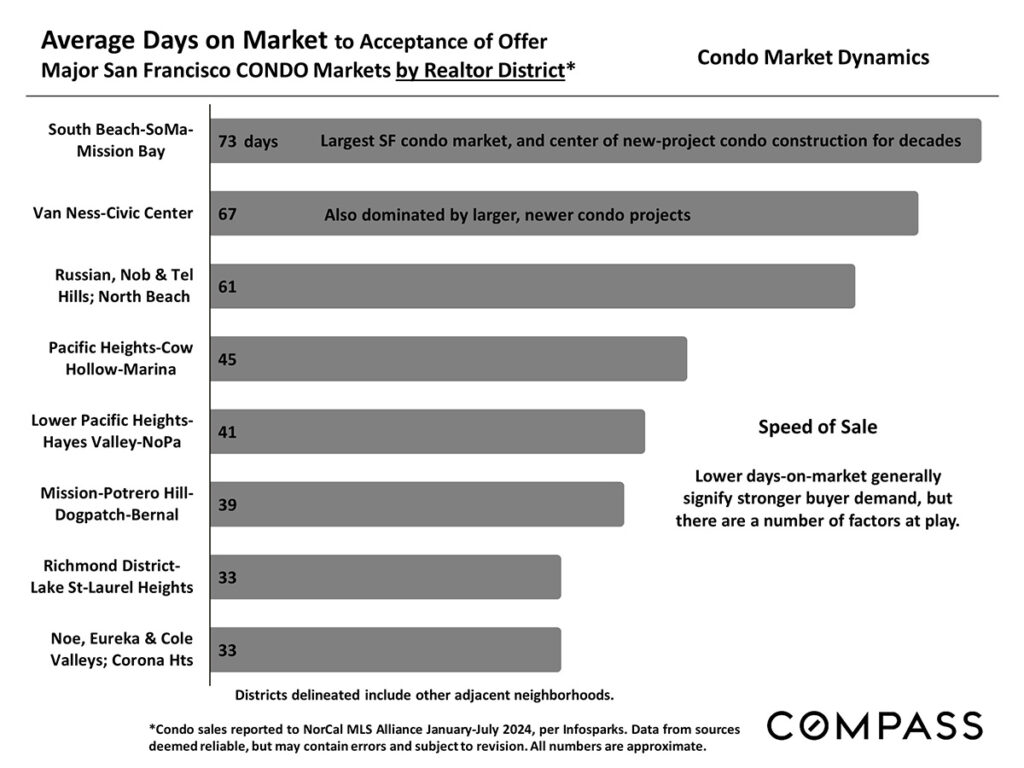
Average Days on Market
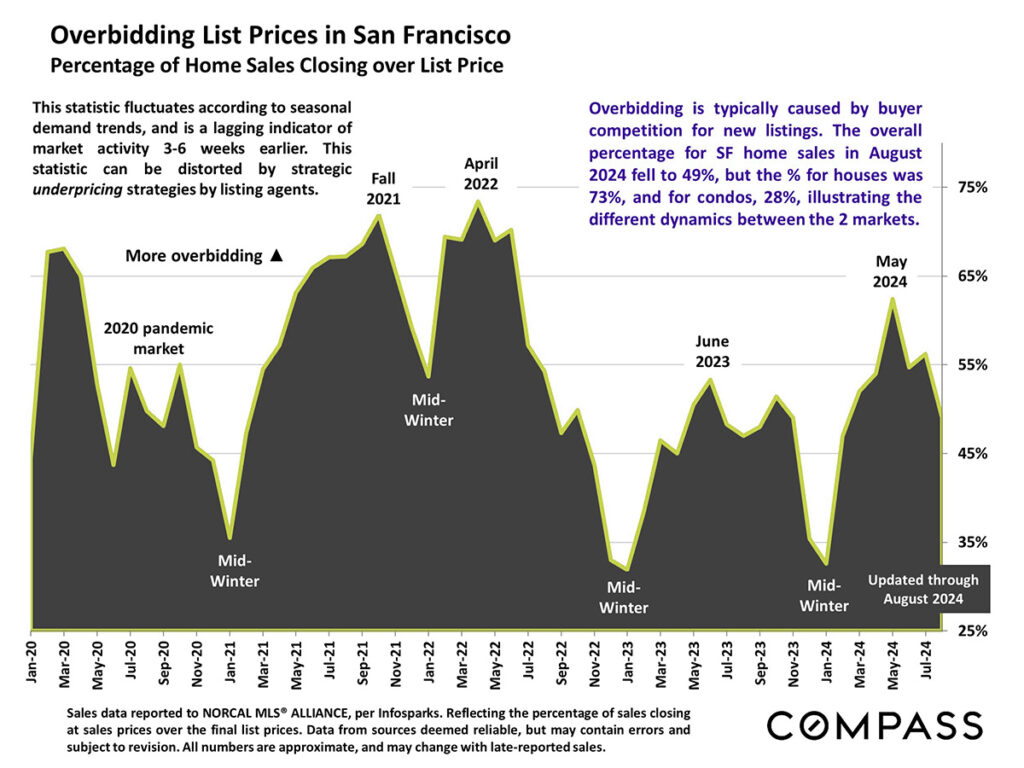
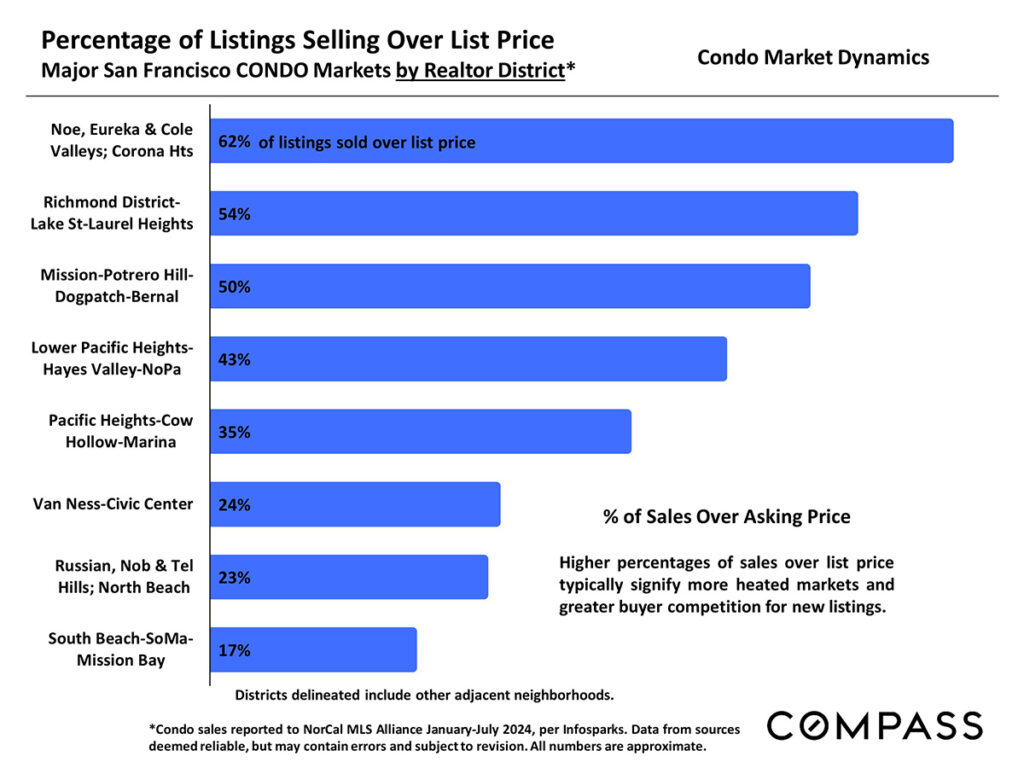
Overbidding List Prices
The overall percentage of listings selling for over list price in August 2024 fell to 49% from the spring peaks. For houses sold, 73% sold for over list price, while for condos 28% sold over list.
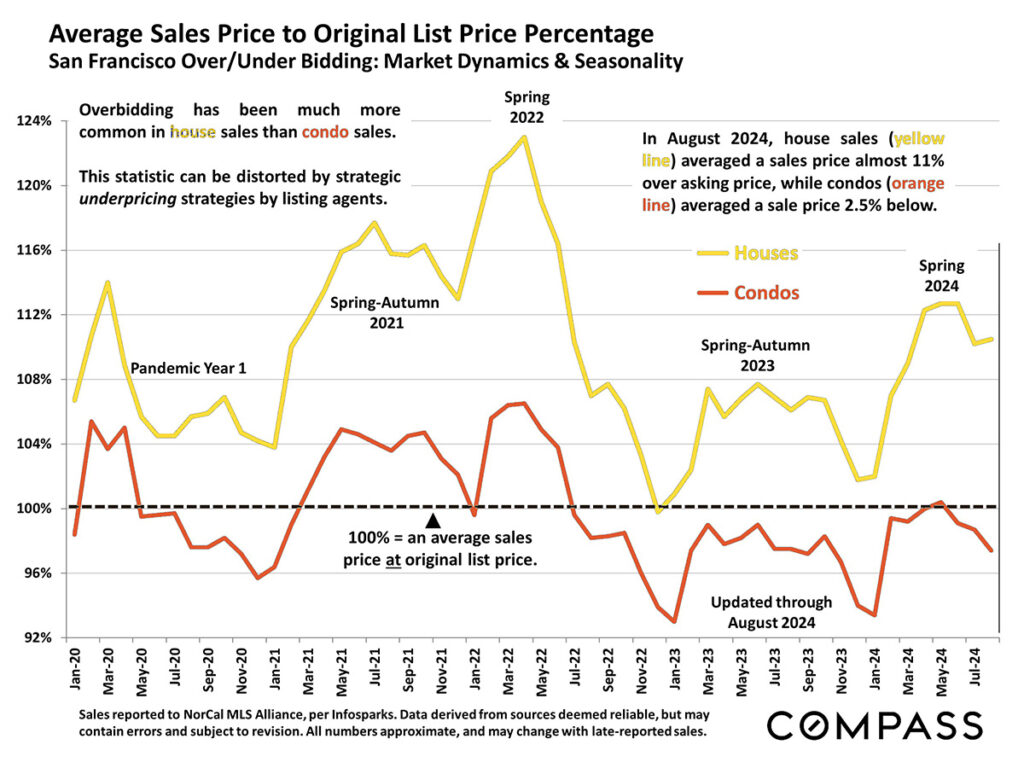
Average Sales to List Price
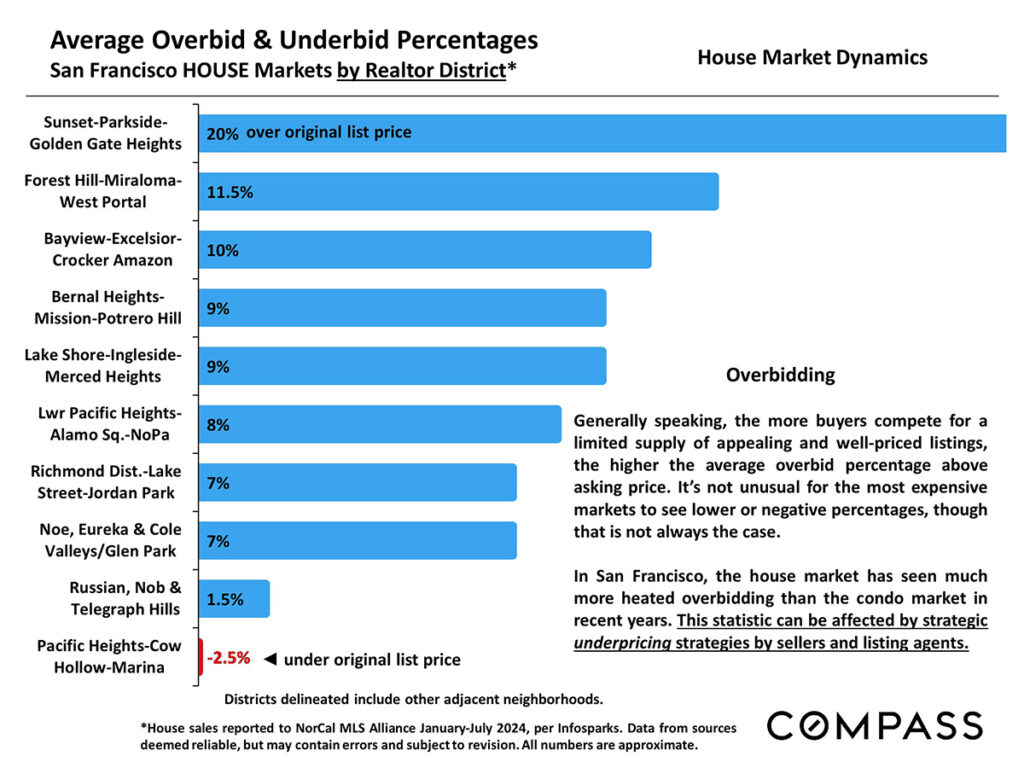
In August 2024, houses averaged a sale price almost 11% over asking price while condos averaged a sale price 2.5% below.
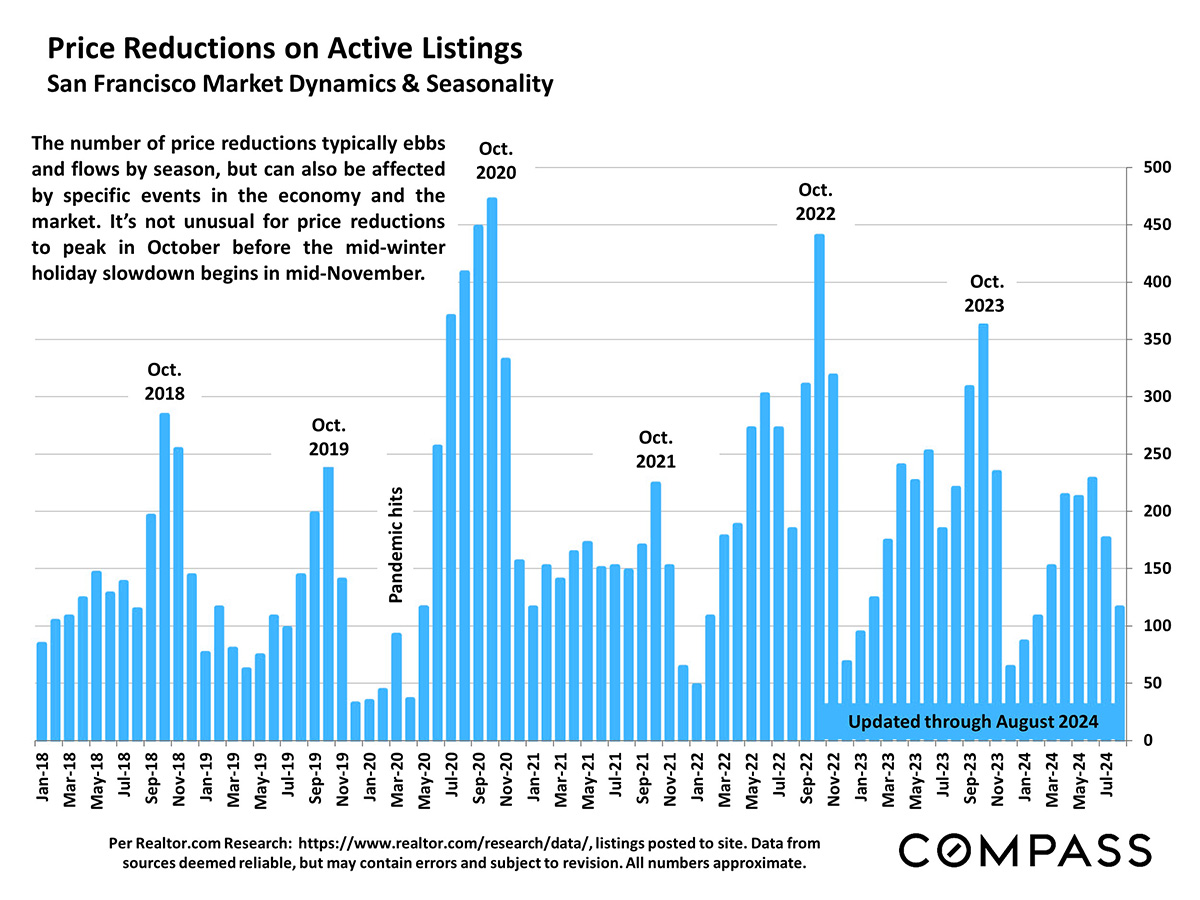
Price Reductions on Active Listings
House Market Dynamics
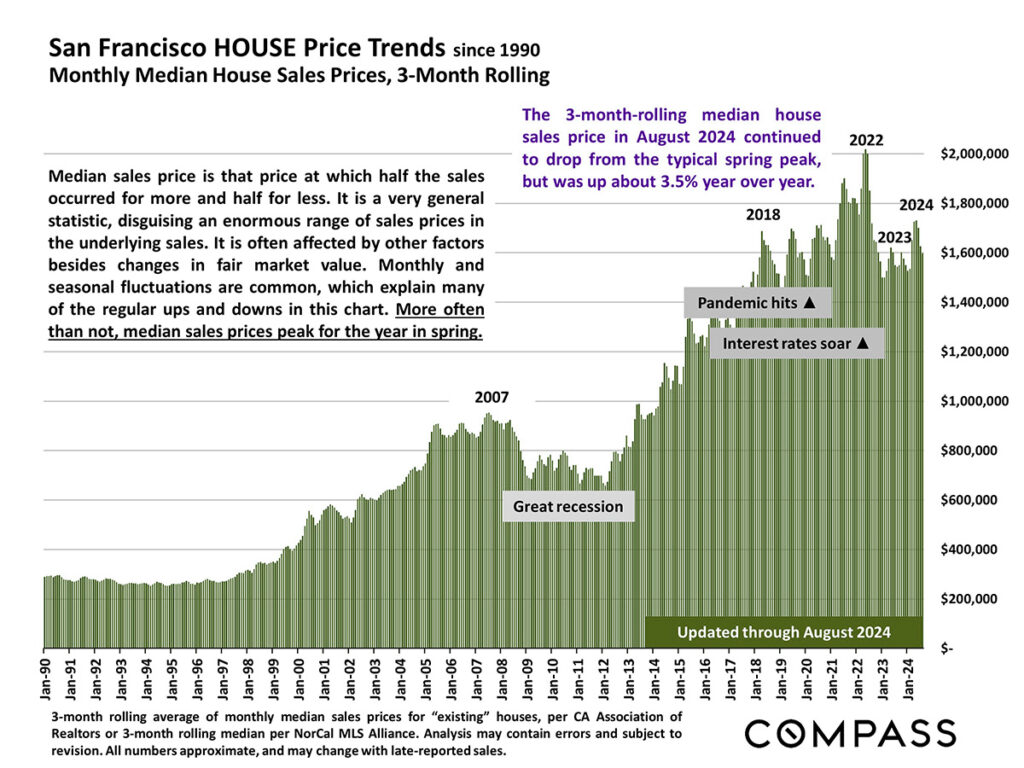
The median house sales price in August 2024 dropped from the typical spring market peak, but remained up about 3.5% compared to last year.
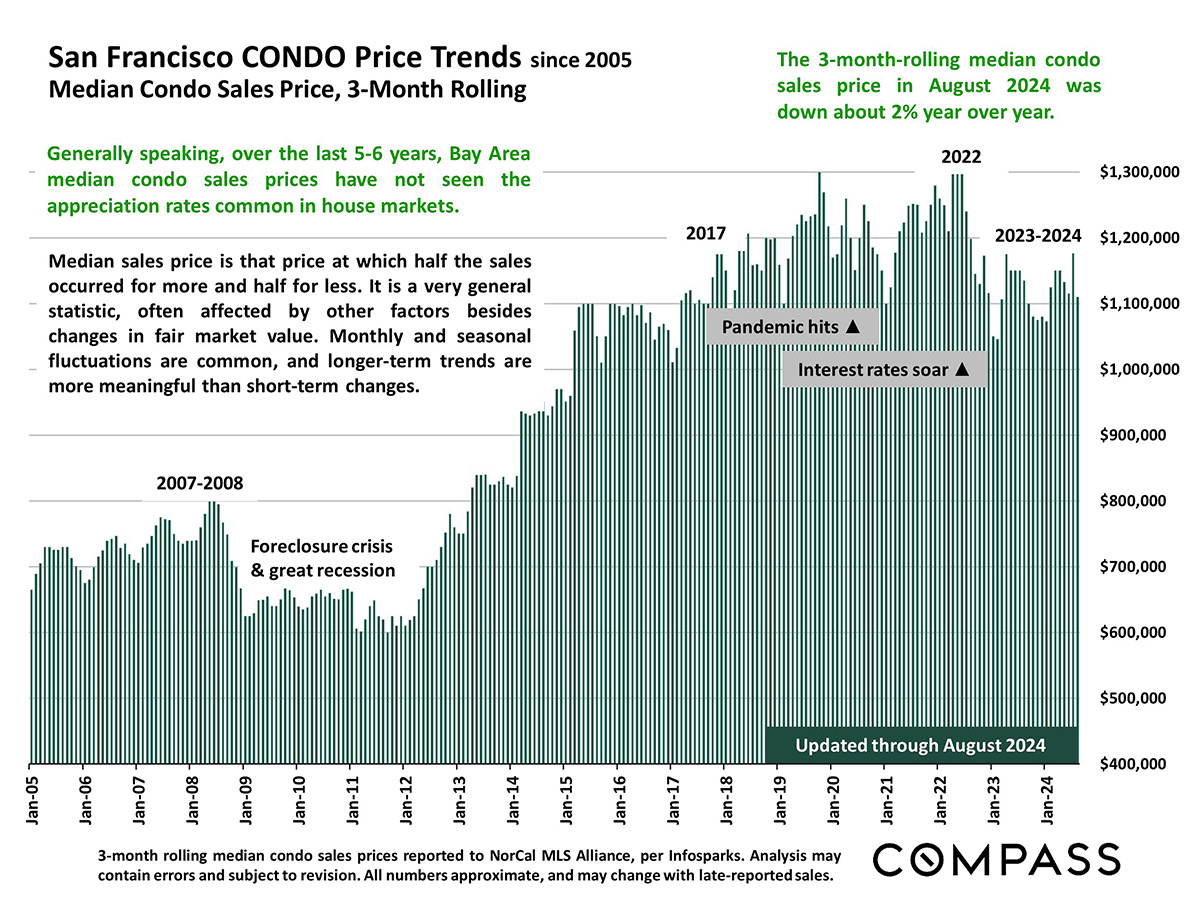
Condo Market Dynamics
The median condo sales price in August 2024 was down about 2% compared to the previous year.
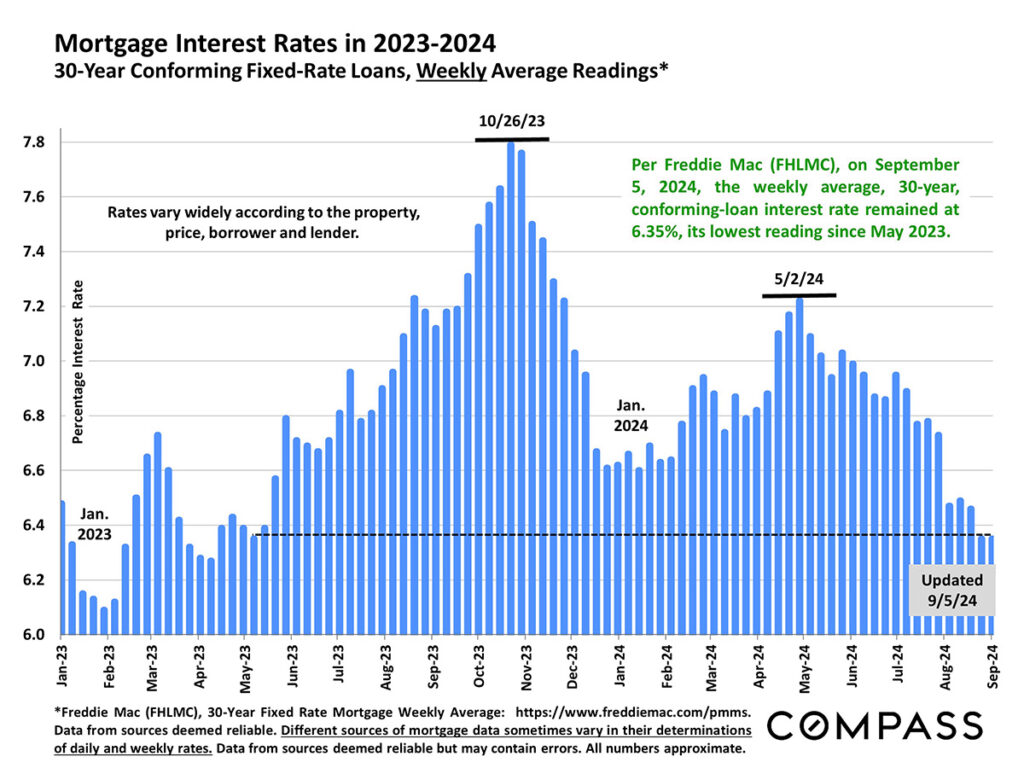
Mortgage Interest Rates
As of September 5, Freddie Mac reported the weekly average 30-year conforming loan interest rate at 6.35%, its lowest reading since May of 2023. As of September 12, mortgage rates were at their lowest level since February 2023 with the average 30-year loan rate at 6.2%.
The information herein is based on or derived from information generally available to the public and/or from sources believed to be reliable. No representation or warranty can be given with respect to the accuracy or completeness of the information.