This month’s data reflect adjustments from the recent heated market conditions. The past few months have seen changes in demand, inventory, overbidding, price reductions, and year-over-year appreciation rates.
As of early August, the average, weekly mortgage rate for a 30-year fixed rate loan fell below 5% for the first time since April (although it rose above 5% again recently), and stock markets have seen large rebounds since early July–but these and other indicators have been subject to sudden changes, and their future directions can’t be predicted. As always, monthly data can be volatile, fluctuating according to a wide variety of factors, including market seasonality. Longer-term trends are more meaningful than short-term fluctuations.
From what I am seeing in the market, buyer interest has begun to rekindle with the increase in inventory and economic changes. And homes that are priced right and in high-demand areas are still selling quickly over asking price.
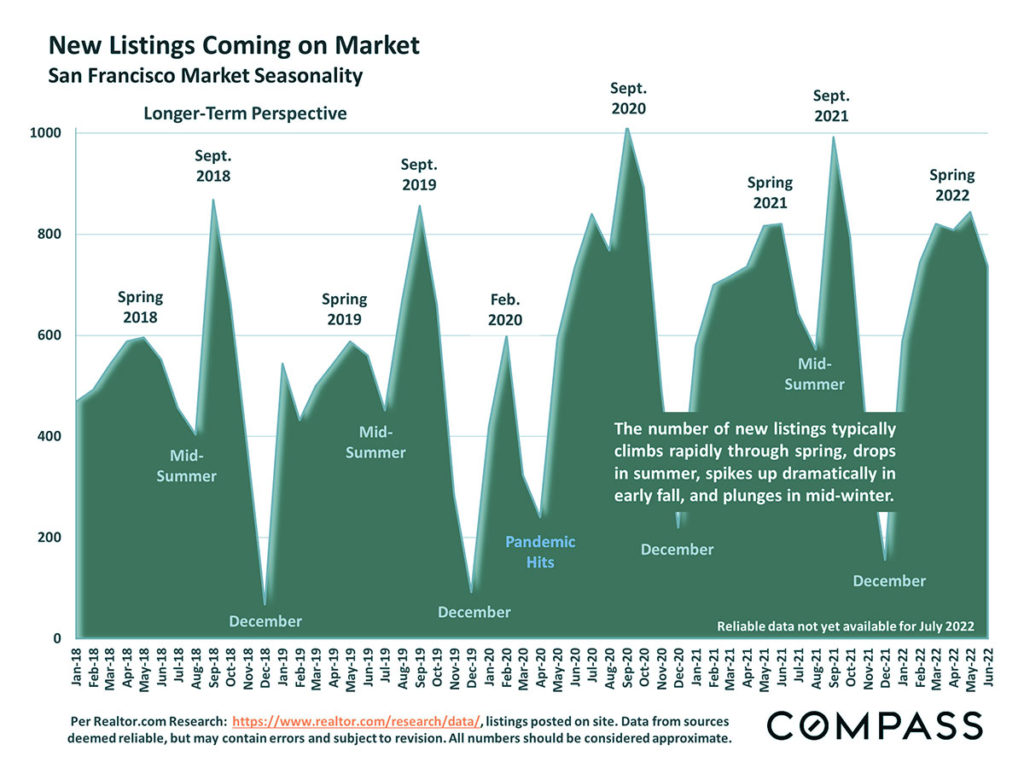
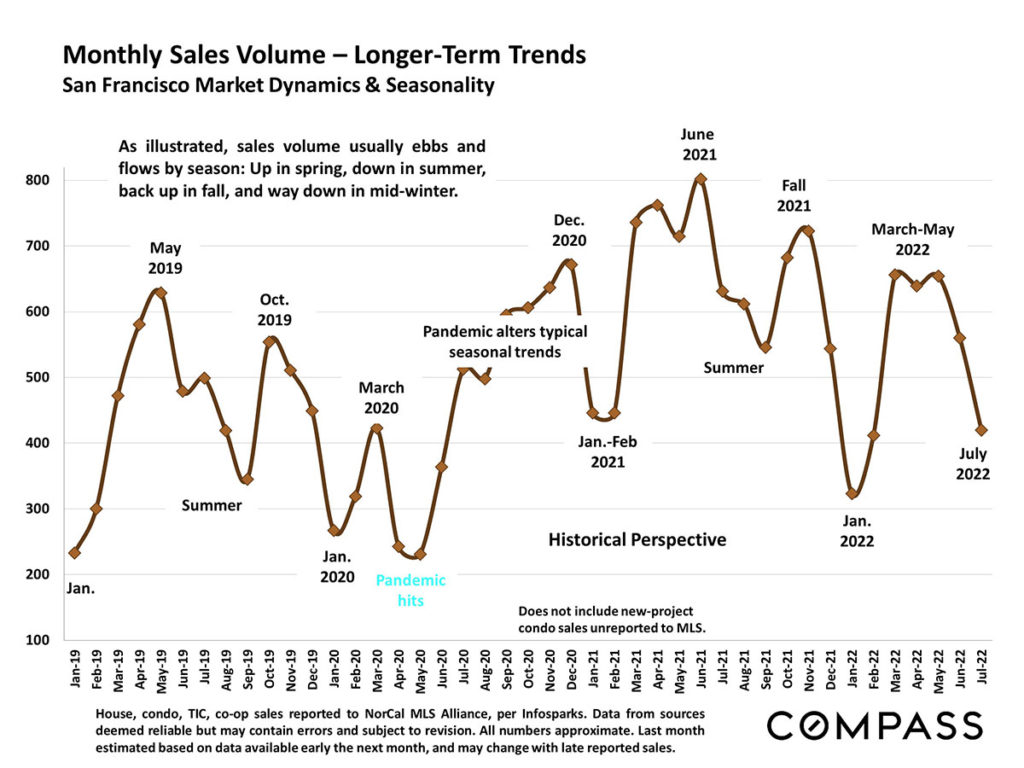
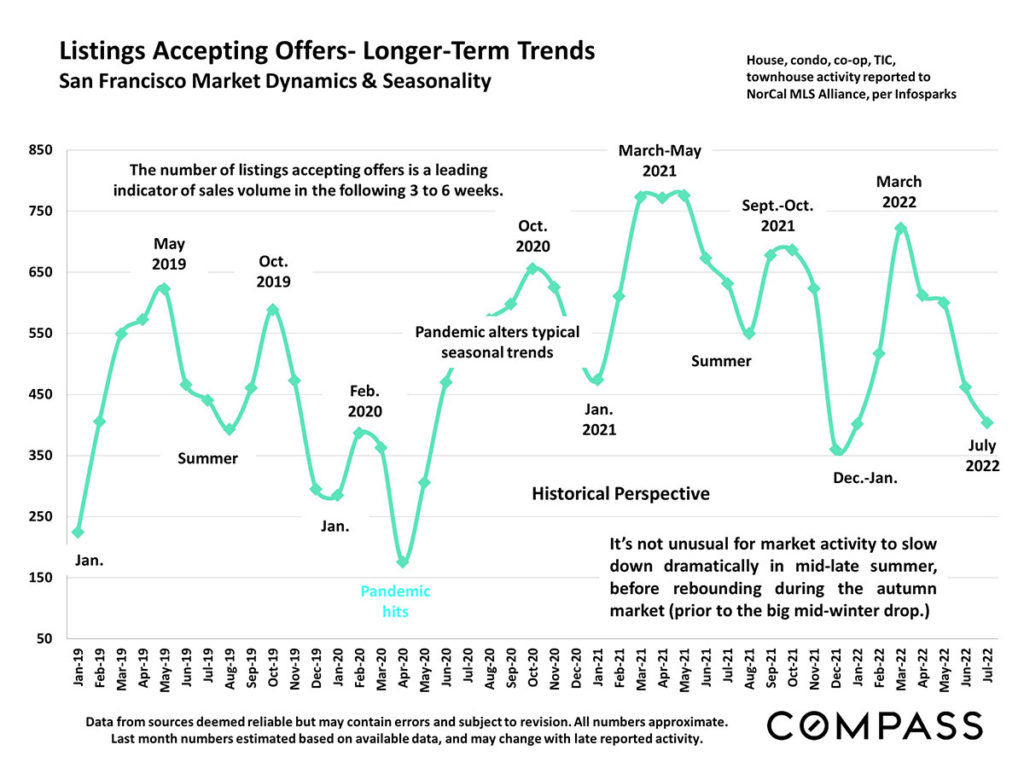
Mid-late summer is usually a much slower period compared to the spring selling season. Autumn typically sees a spike in new listings and sales prior to the mid-winter slowdown.
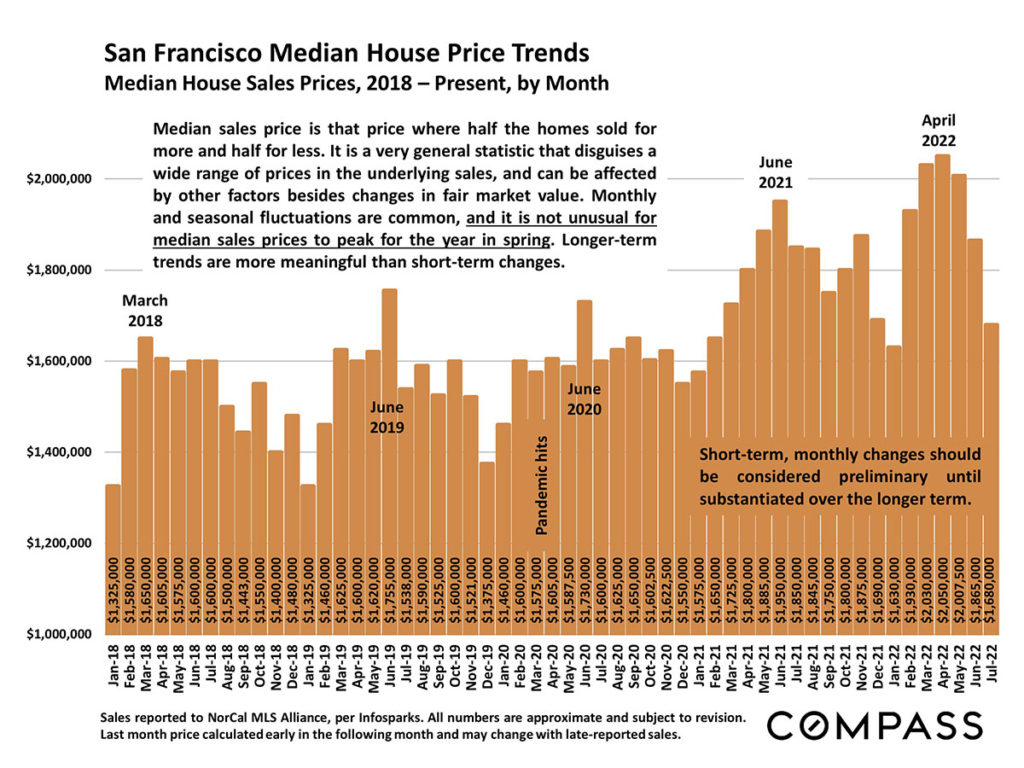
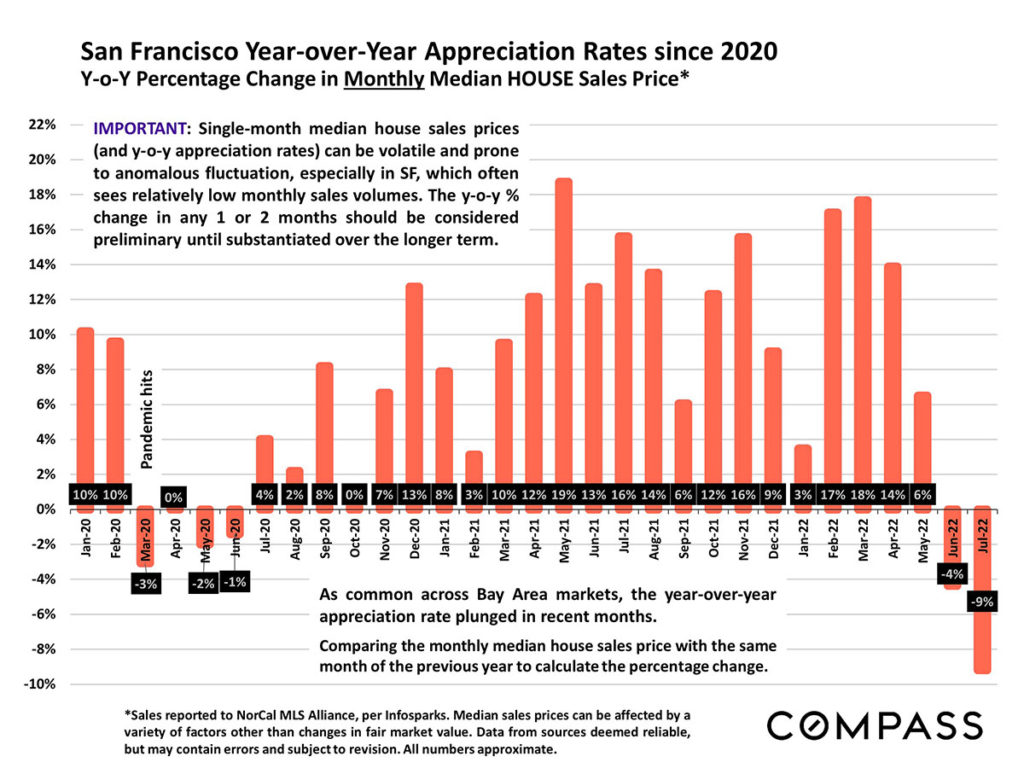
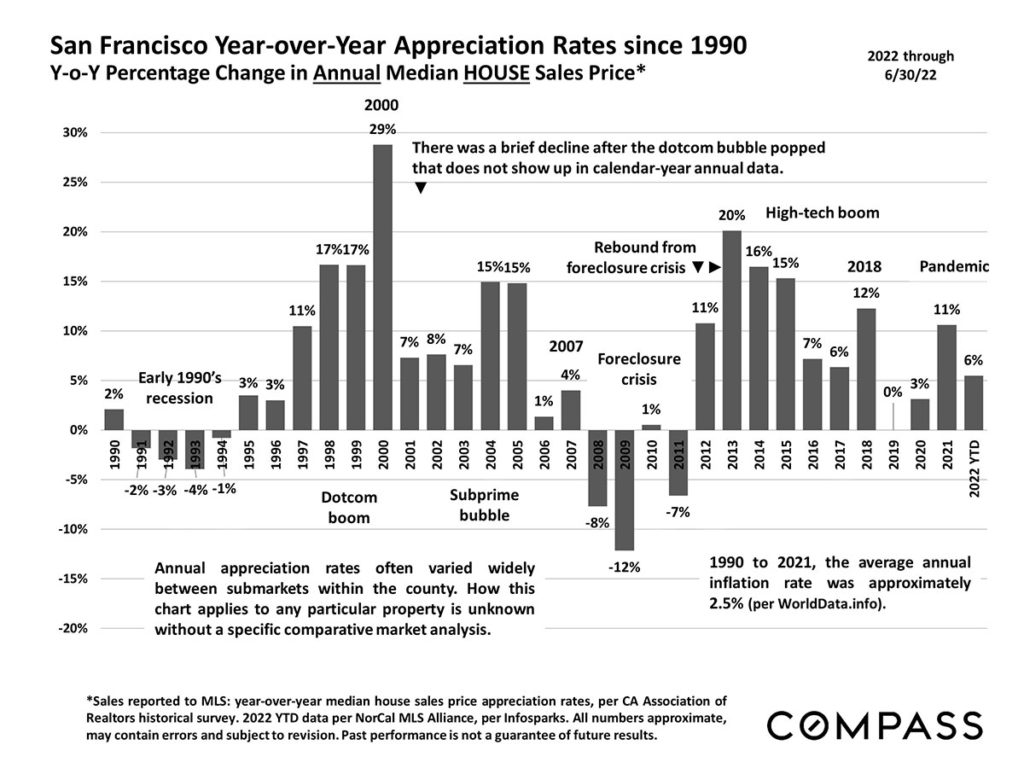
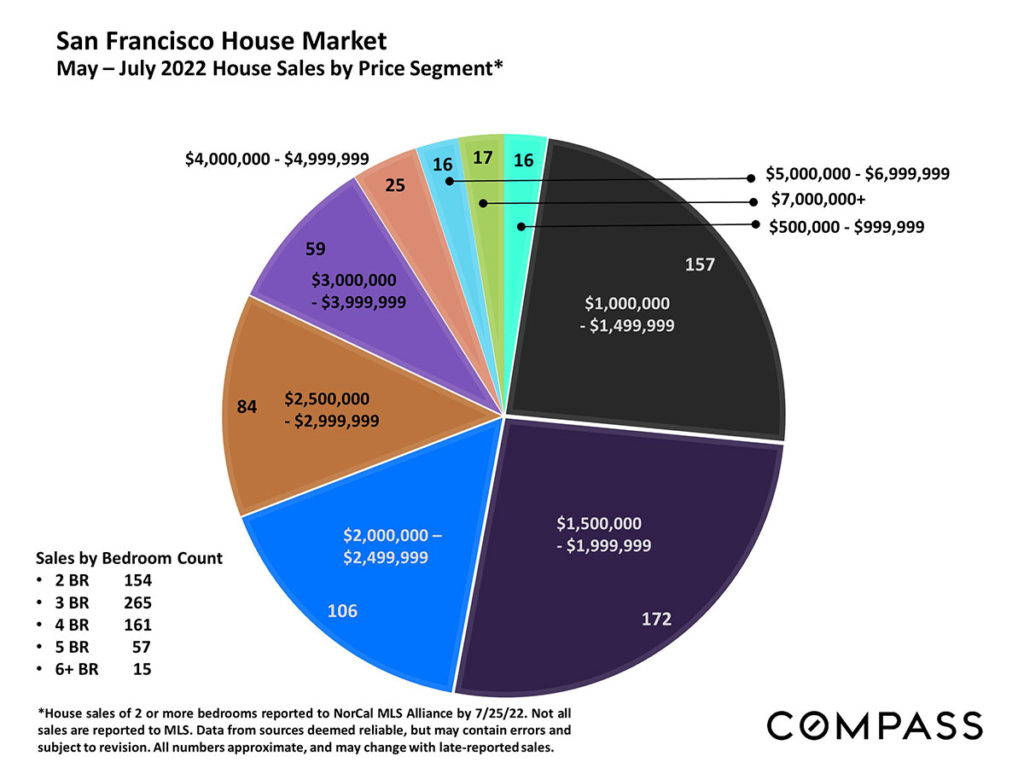
House Sales Trends
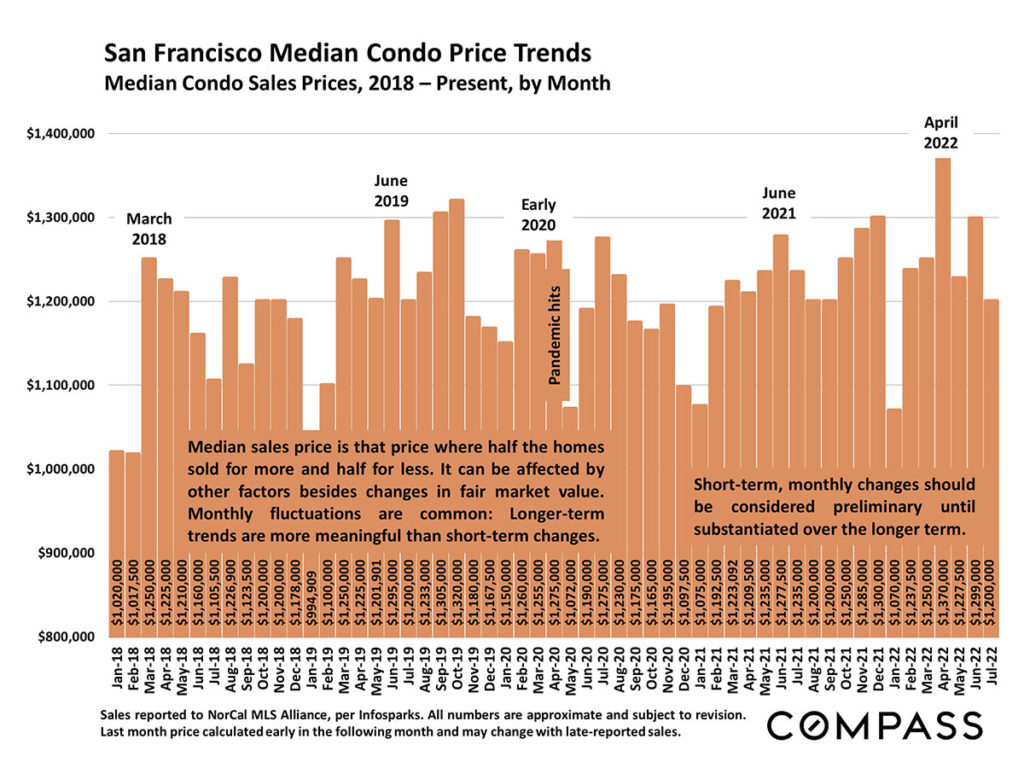
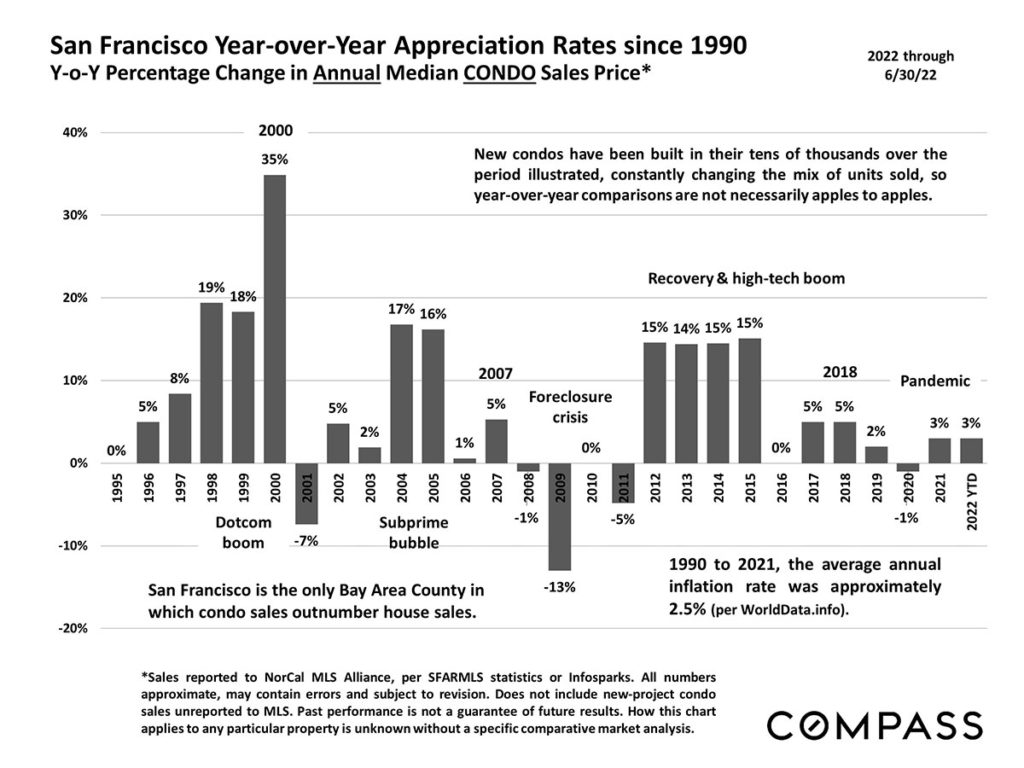
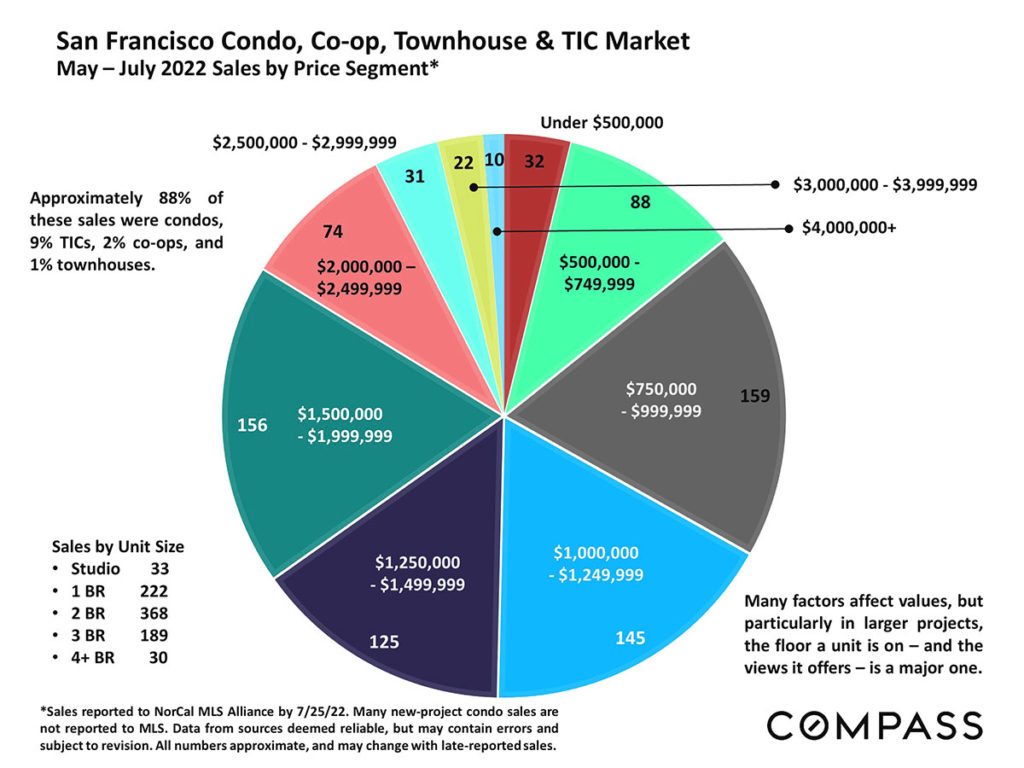
Condo Sales Trends
New Listings Coming on Market
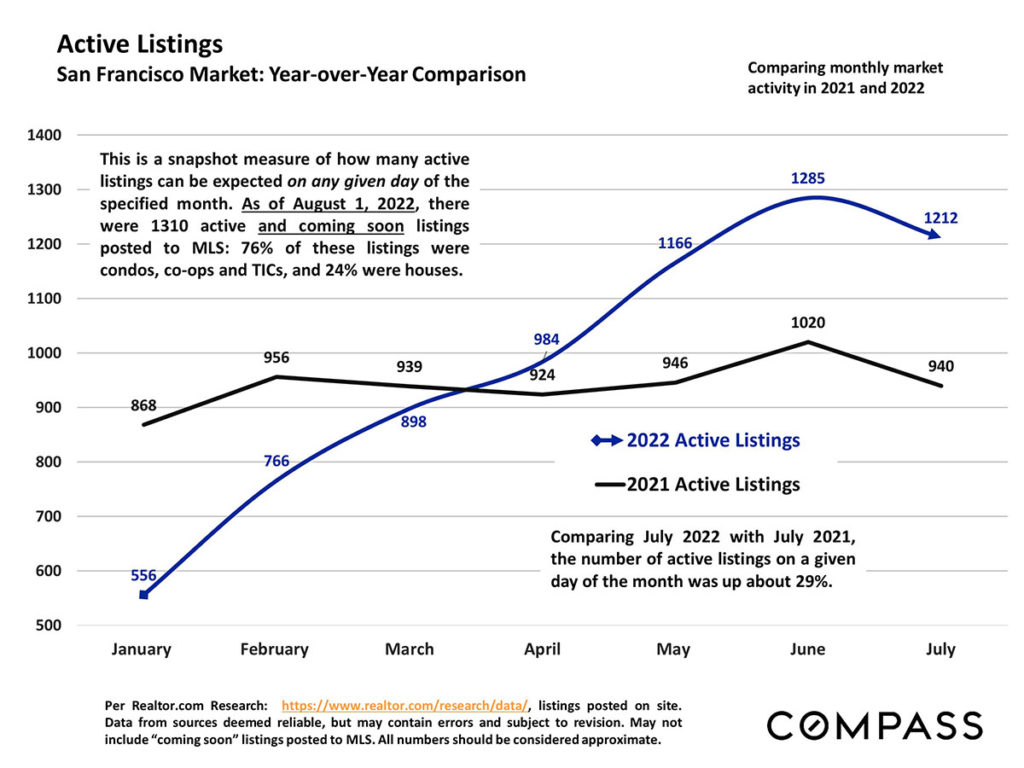
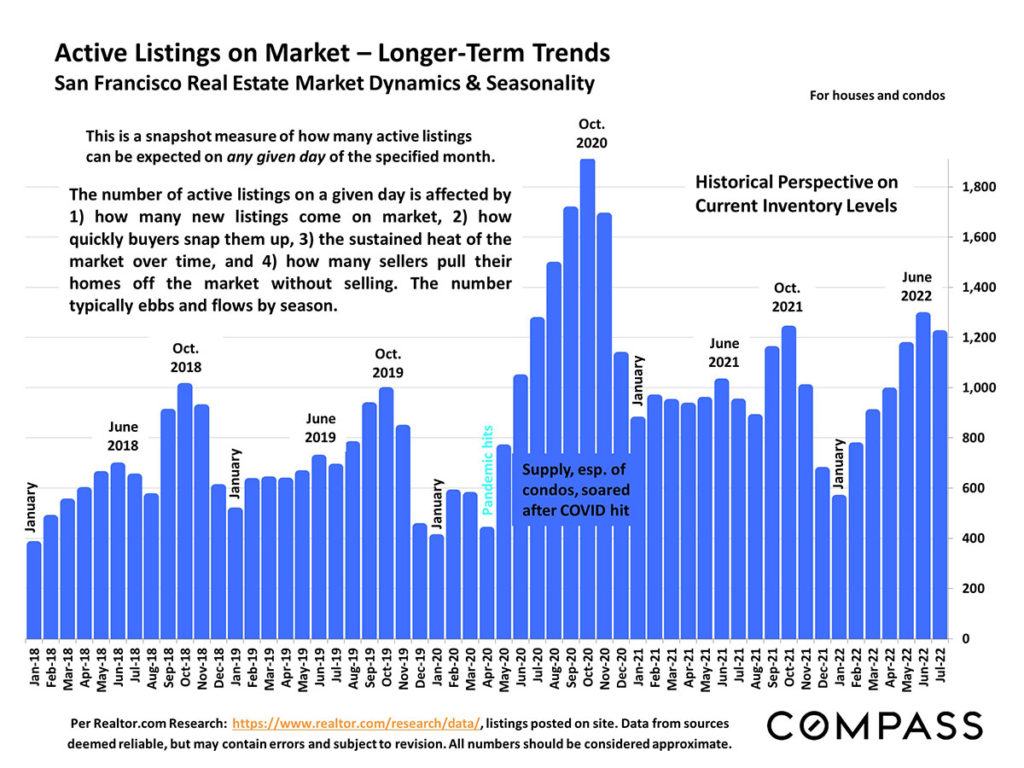
Active Listings
The majority of active listings are condos, co-ops and TICs while houses represent 25% of active listings. Comparing to last year, on any given day in July this year the number of active listings was up by around 29%.
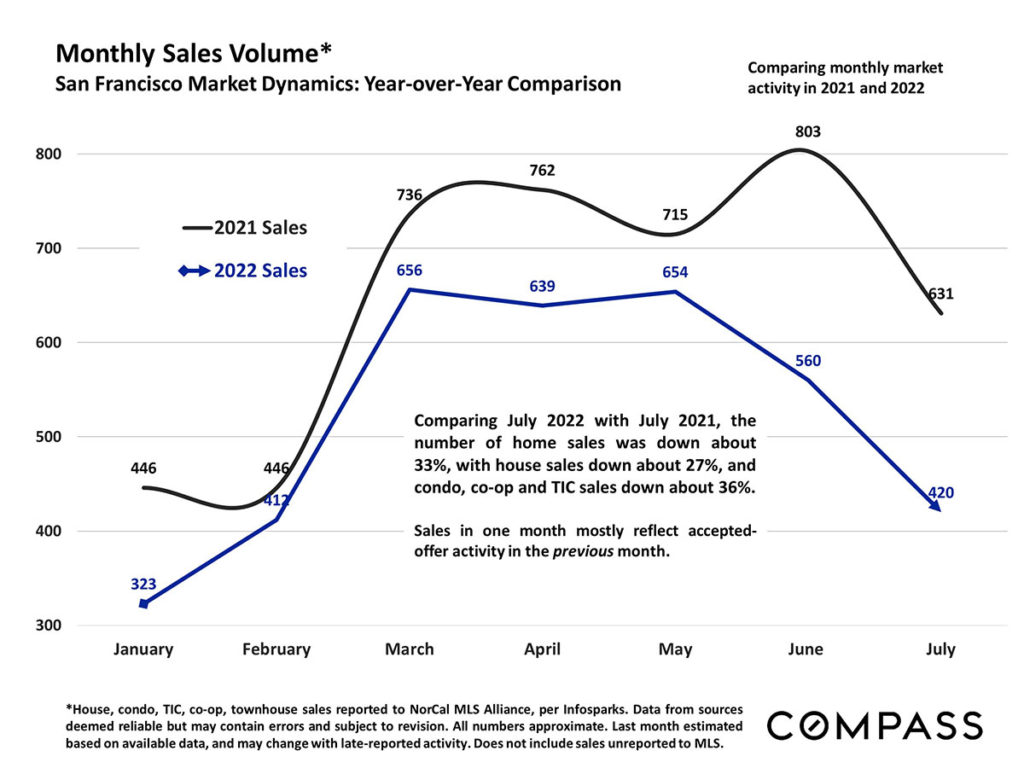
Monthly Sales Volume
Home sales were down about 33% overall, with house sales down 27% and condo, co-op and TIC sales down about 36%.
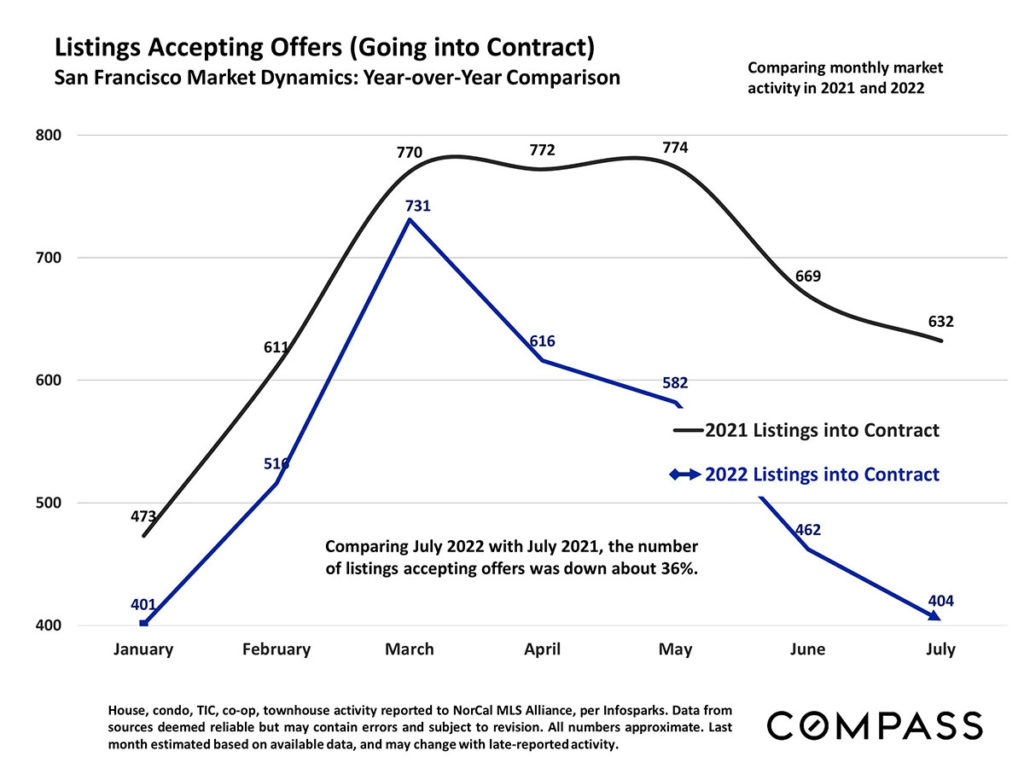
Listings Accepting Offers
The number of listings accepting offers was down 36% compared to this time last year.
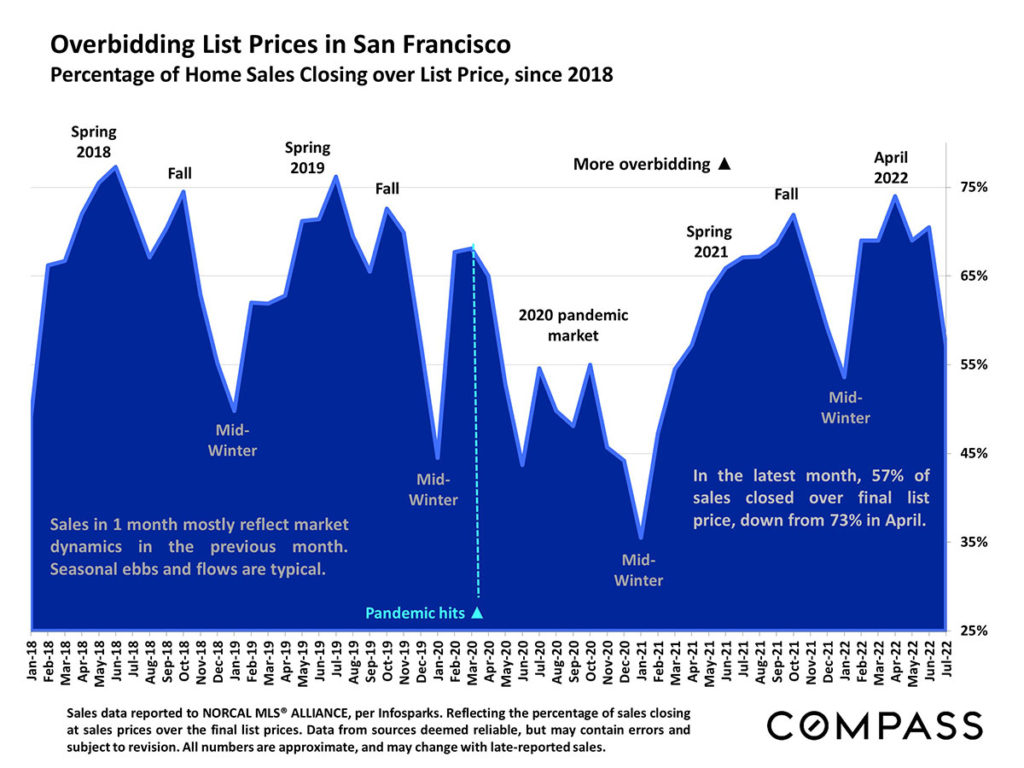
Overbidding List Prices
The latest month’s data (reflecting market dynamics in the previous month) indicate that 57% of all sales closed over list price, which is down from 73% in April.
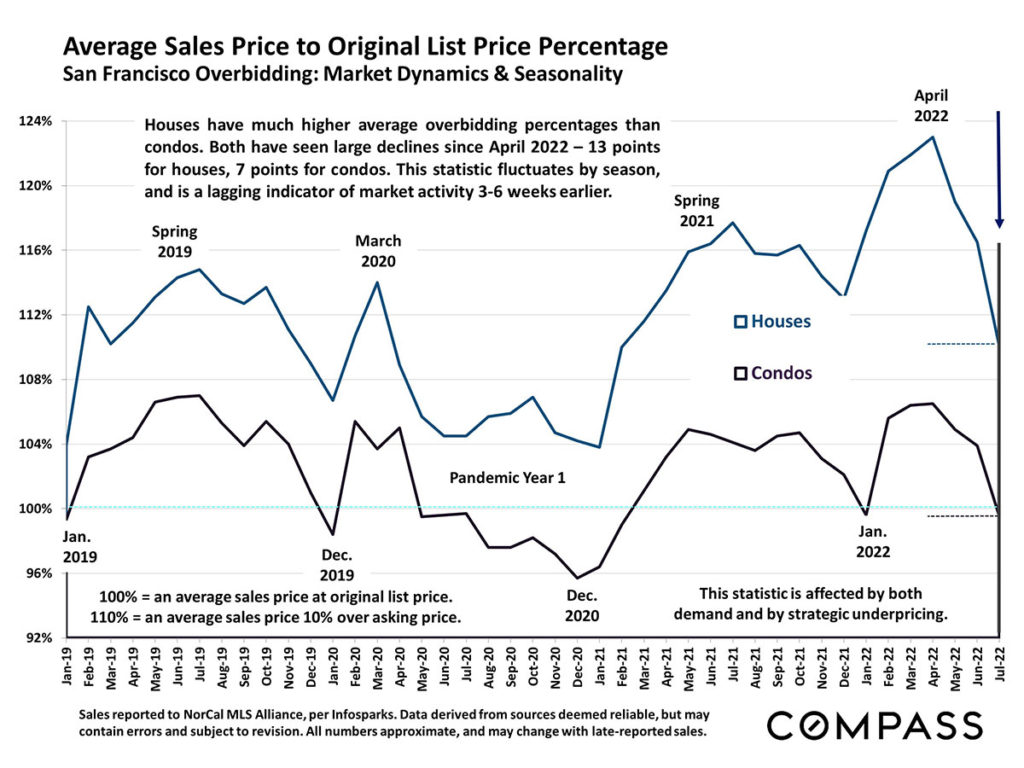
Average Sales Price to List Price
While both houses and condos have seen declines in average overbidding percentages since April, houses still have a much higher percentage than condos.
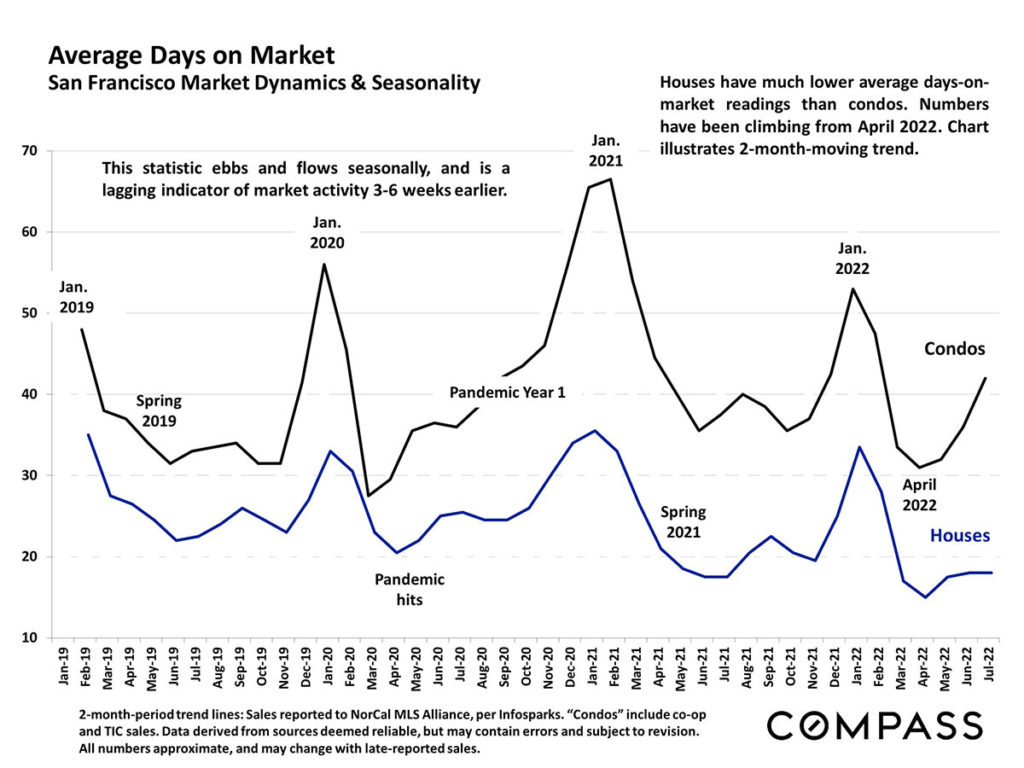
Average Days on Market
Average days on market is significantly higher for condos, although it has increased for homes as well since April.
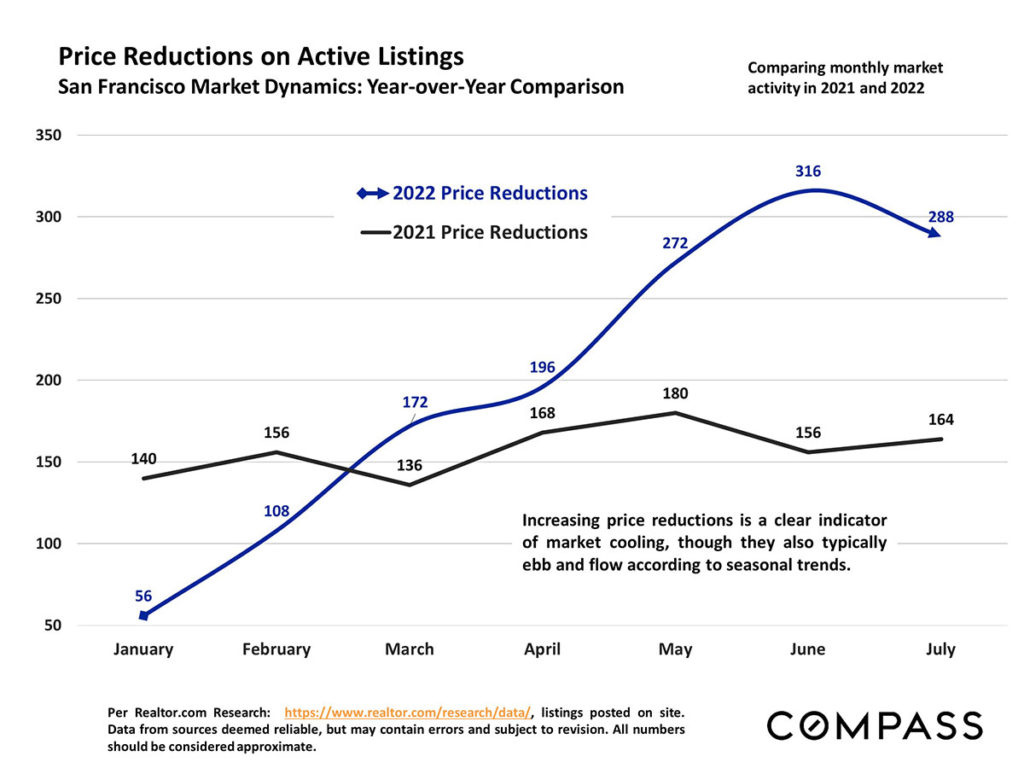
Price Reductions on Active Listings
While price reductions tend to follow seasonal trends, the increasing amount of reductions this year is an indication that the market is cooling.
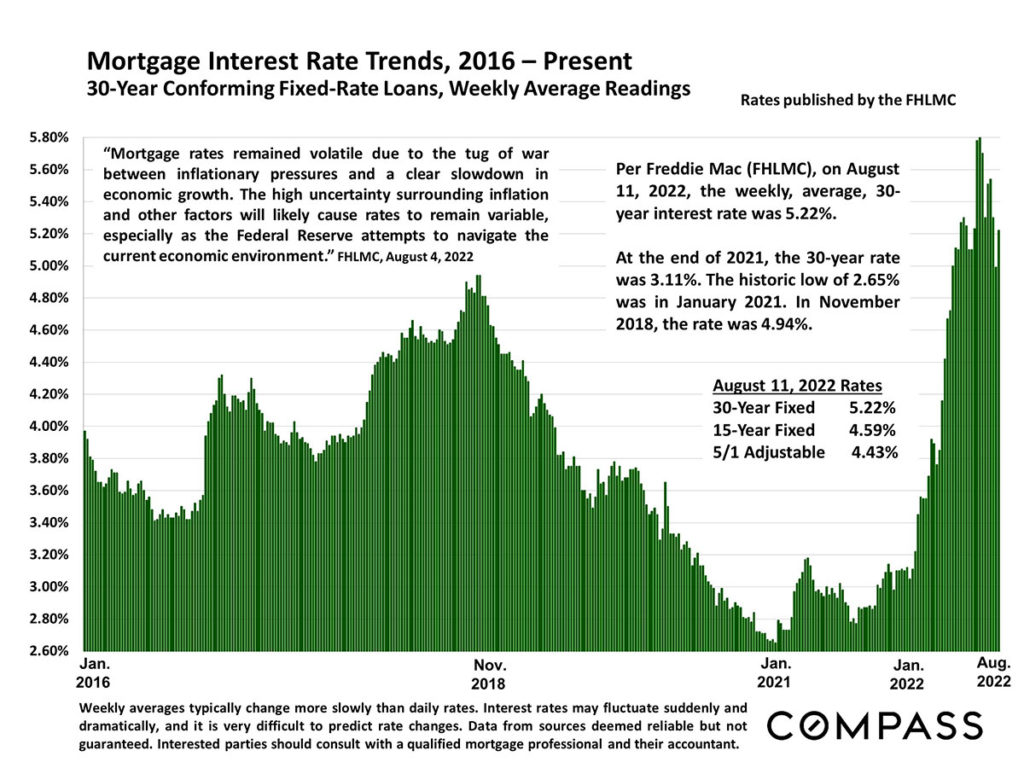
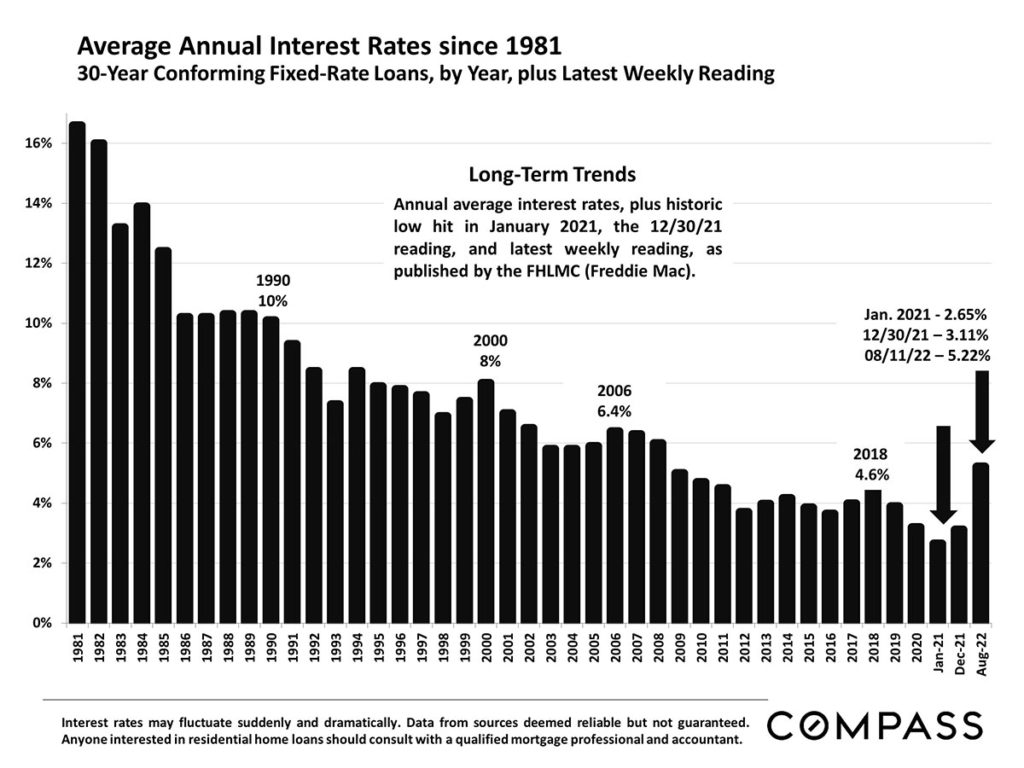
Mortgage Rates
After dropping just below 5% recently, mortgage rates increased again, with 30-year fixed rates currently at 5.22%.
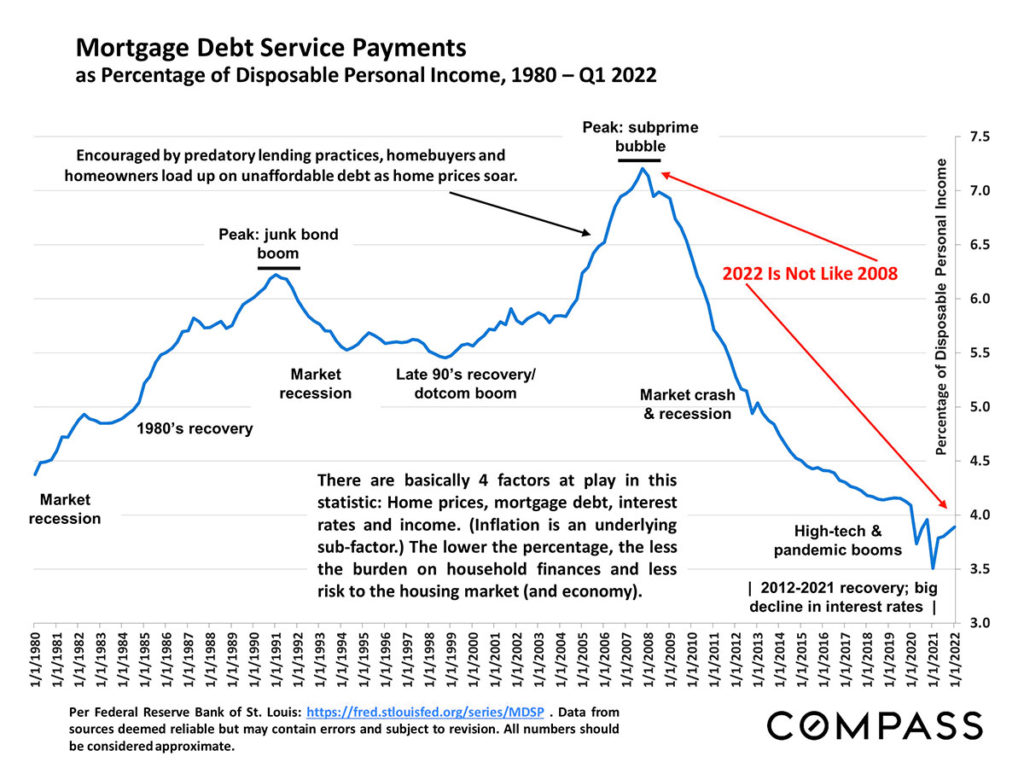
Mortgage Debt Service Payments
While some are drawing comparisons between the current market and the housing market crash in 2008, the conditions between then and now are vastly different. As illustrated in the chart below, for example, mortgage debt service payments as a percentage of disposable income peaked in 2008; they remain near historical lows currently. The lower the percentage, the lower the amount of financial burden on households, and the less risk to the housing market.
The information herein is based on or derived from information generally available to the public and/or from sources believed to be reliable. No representation or warranty can be given with respect to the accuracy or completeness of the information.