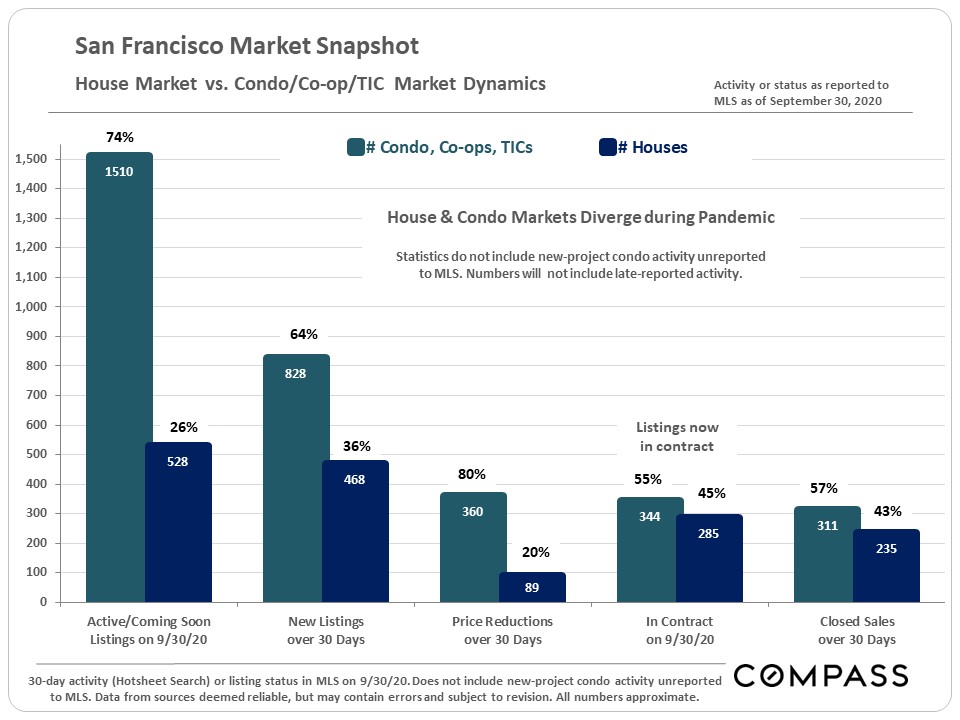
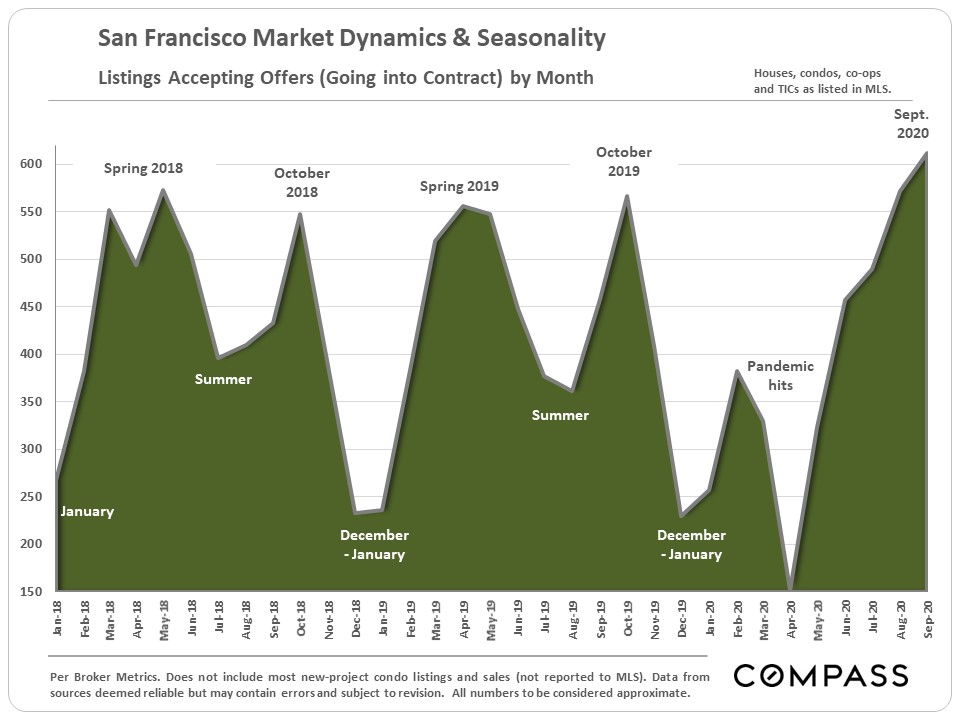
Reflecting a frenzy of activity this summer, more listings went into contract in September than in any month over the past two years. Even with all this activity, the market for houses and condos continues to diverge, with price reductions and inventory heavily concentrated in the condo market. But as with any market, good condos in desirable locations are still selling for premium prices.
Year Over Year Comparison
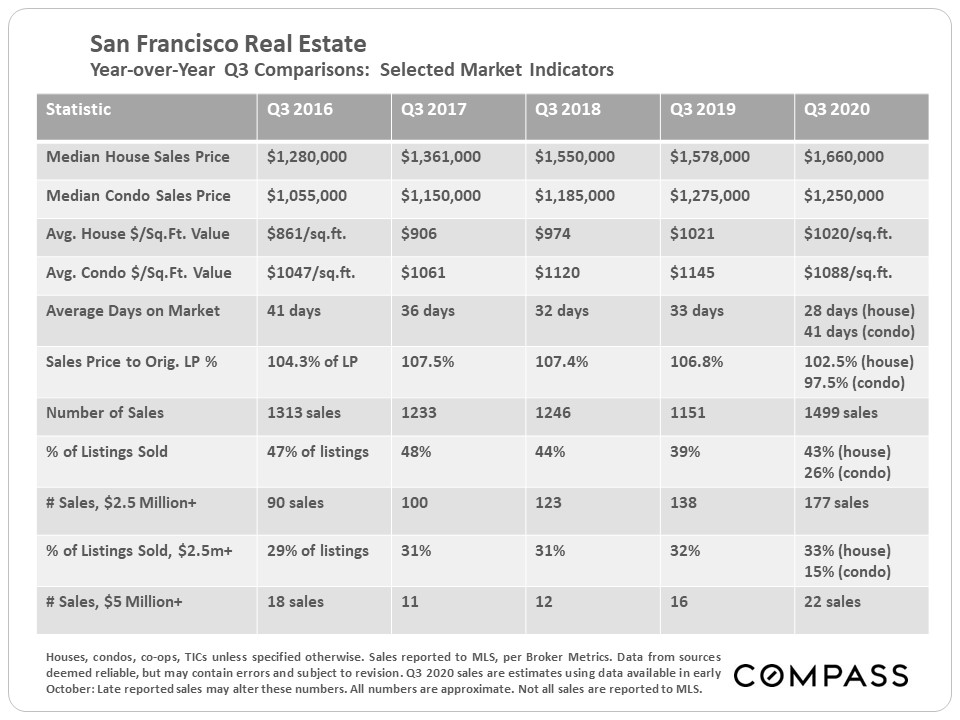
The table below compares Q3 statistics across the past five years. Since the dynamics of the market for houses and condos have significantly diverged since the pandemic struck, some of the 2020 stats are broken out separately in the table, and then in some of the following charts.
Condo Supply Outpaces Demand
The inventory of condo listings on the market has been soaring, and price reductions are primarily impacting condos. Hundreds are still selling each month and that number has been rebounding in the last few months, but increases in supply continue to outpace demand.
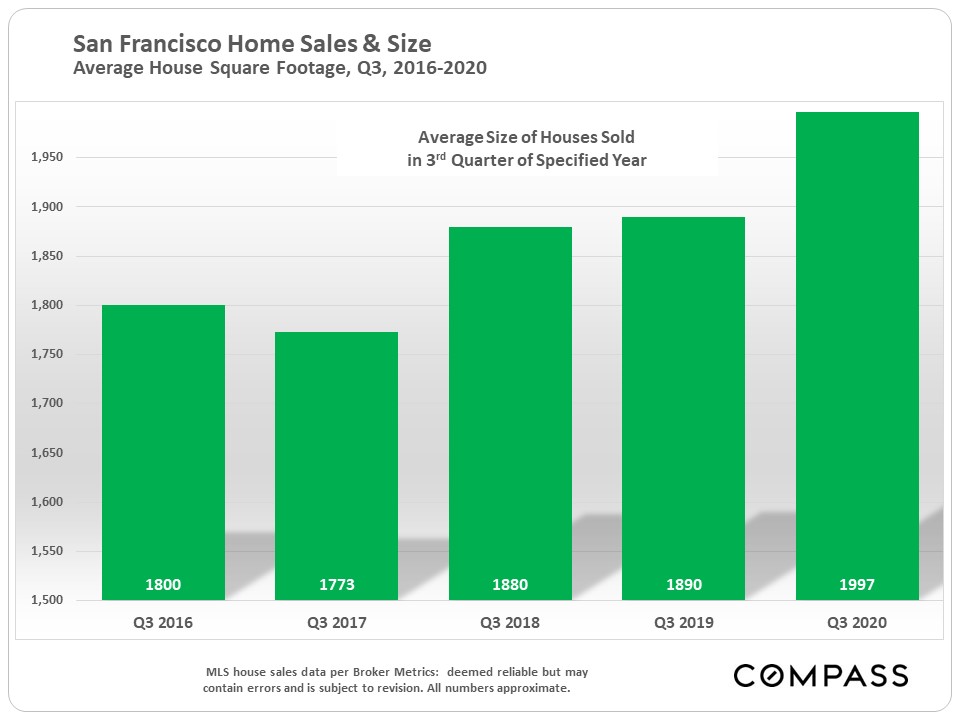
Home Sales and Size
Median sales prices can rise because of increases in fair market value—i.e. buyers are paying more money for the same home (supply and demand)—and/or because buyers are purchasing larger or more expensive houses. Affluent and very affluent buyers are an increasing percentage of the total market throughout the Bay Area. In San Francisco, the average size of houses sold in Q3 jumped almost 6% year over year.
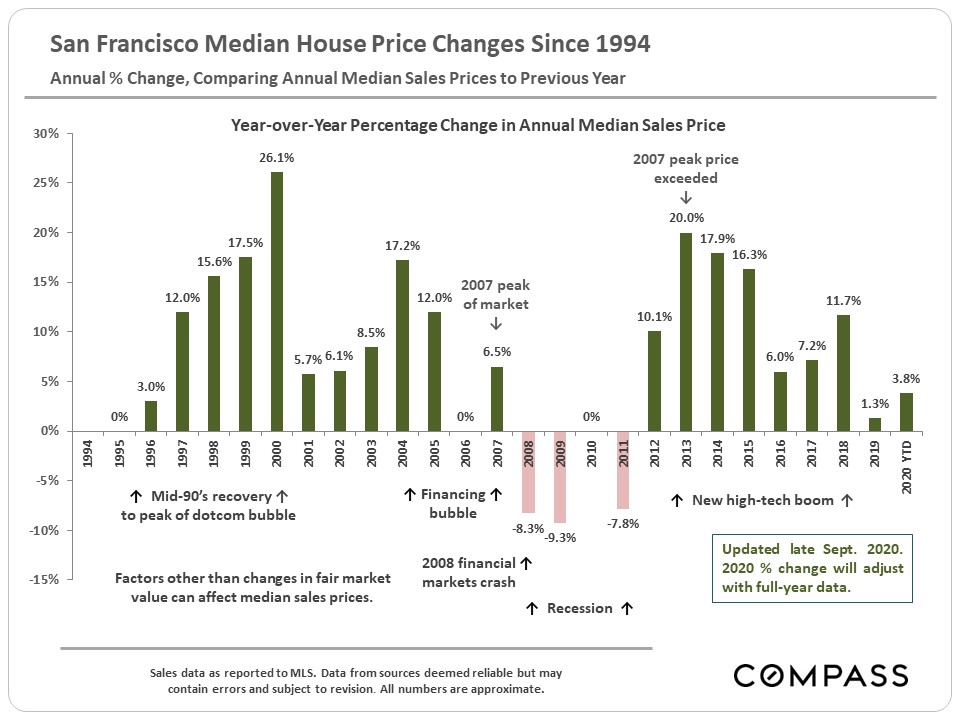
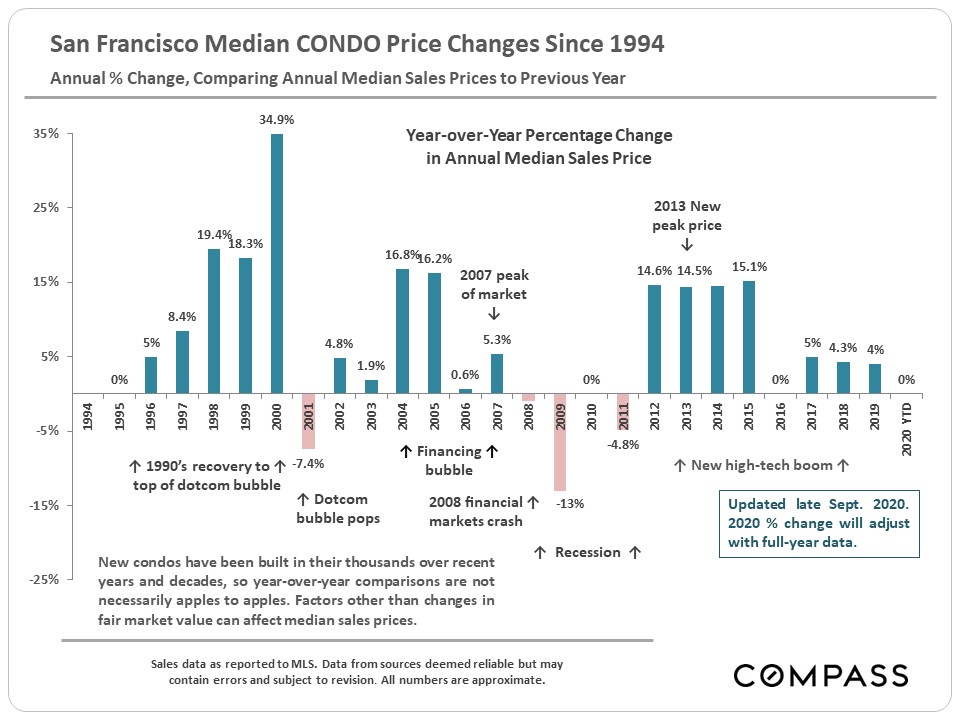
Annual Percentage Change in Median Sales Prices
The following two charts show the change in annual median prices for houses and condos over time. The 2020 YTD percentage will certainly change by the time full-year sales data is in.
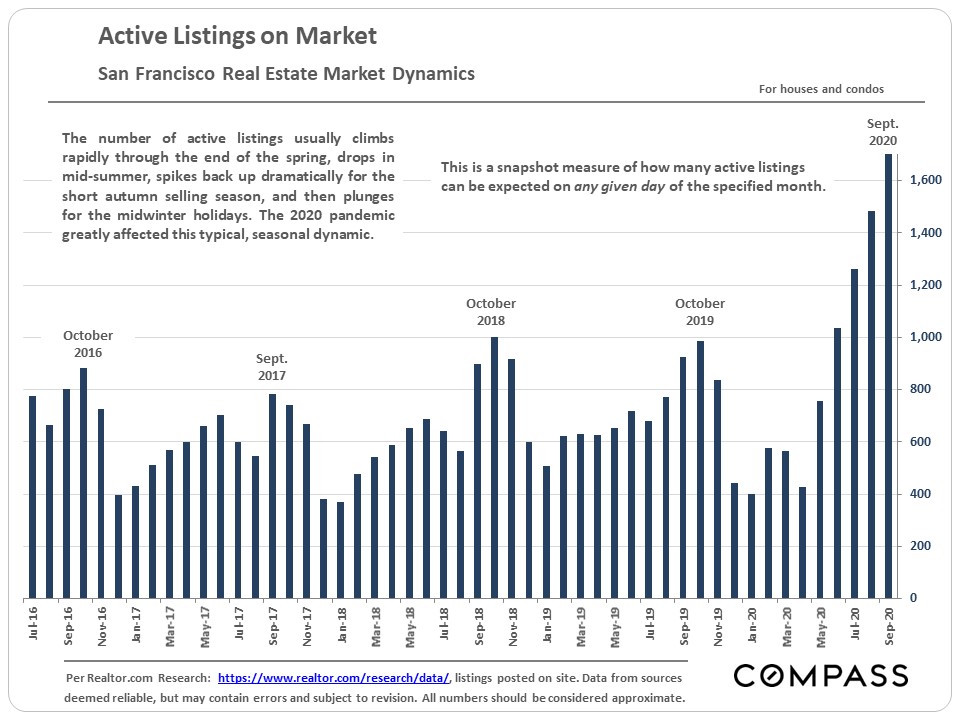
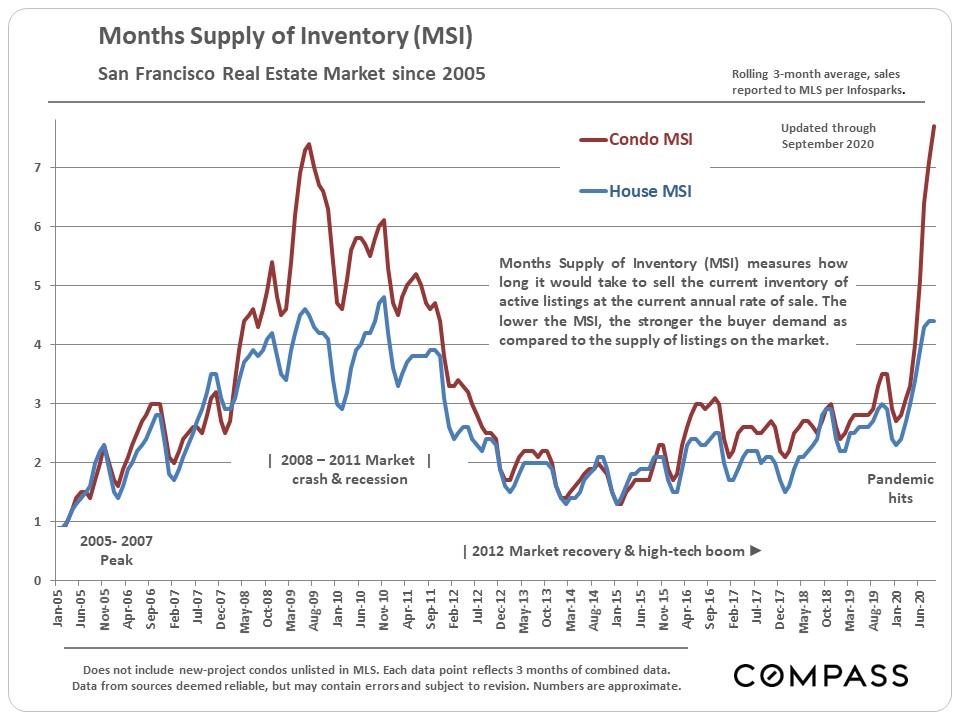
Active Listings and Inventory
Active inventory has been surging in recent months (first chart below), as has the months supply of inventory (second chart). As mentioned before, the supply of condos for sale is currently dominating inventory in San Francisco.
Even if supply is outpacing demand, more listings went into contract in September than in any month in the last two years.
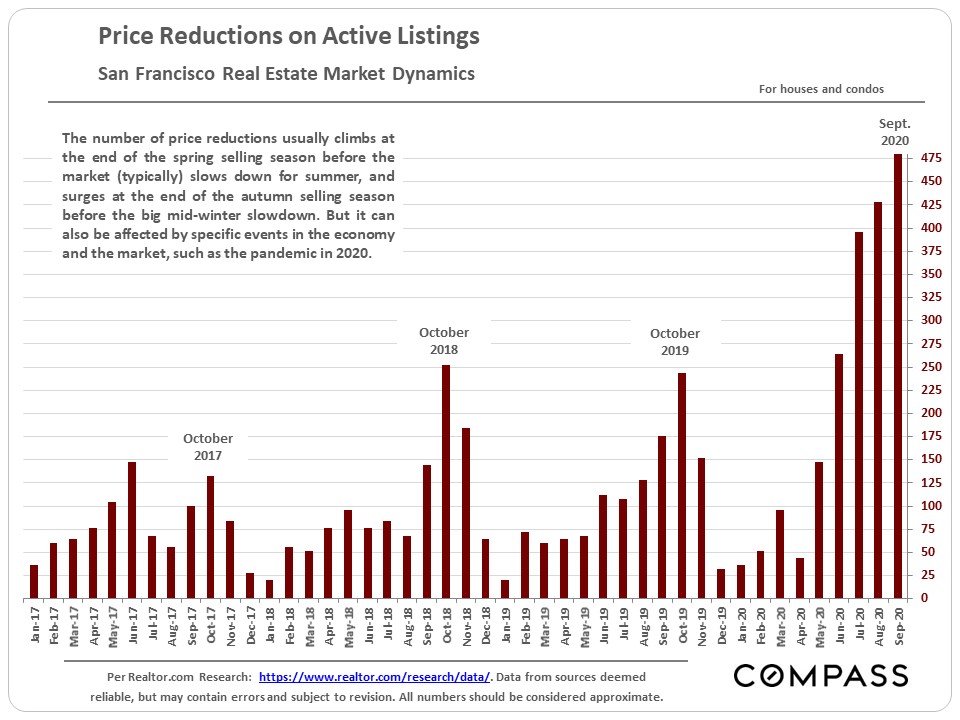
But the number of price reductions—again heavily concentrated in the condo market—has jumped to its highest point in many years. In certain segments, sellers are now competing for buyers, instead of buyers competing for listings.
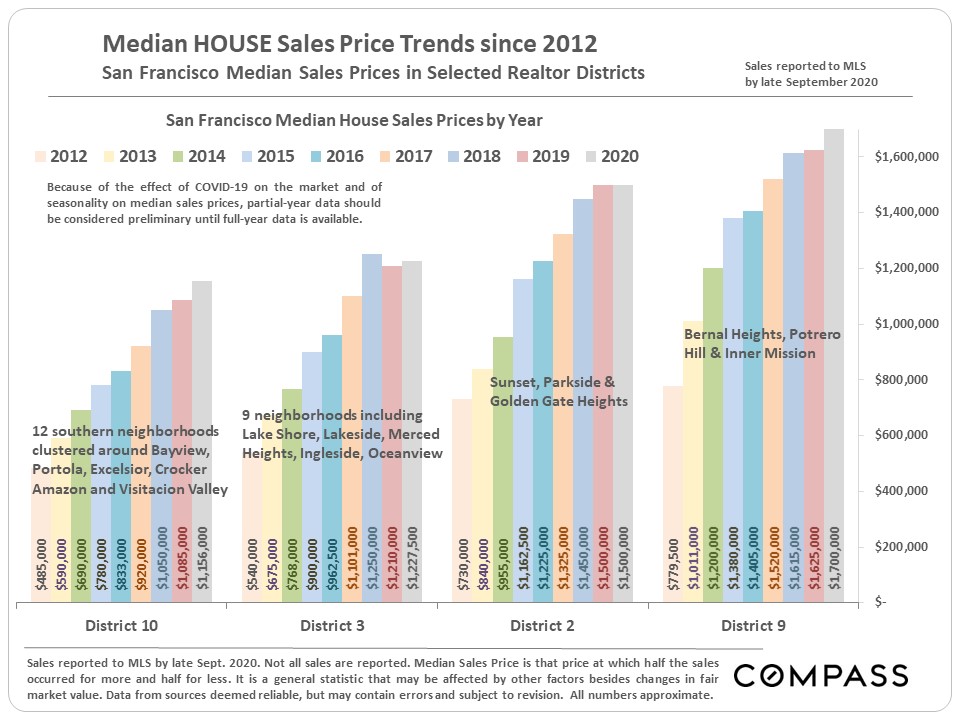
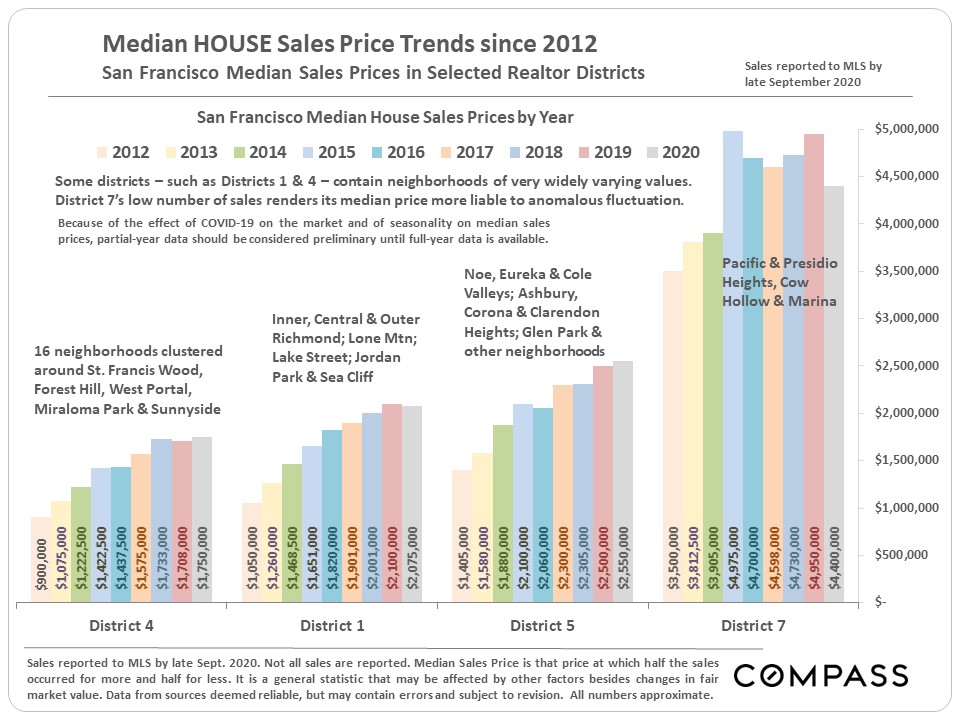
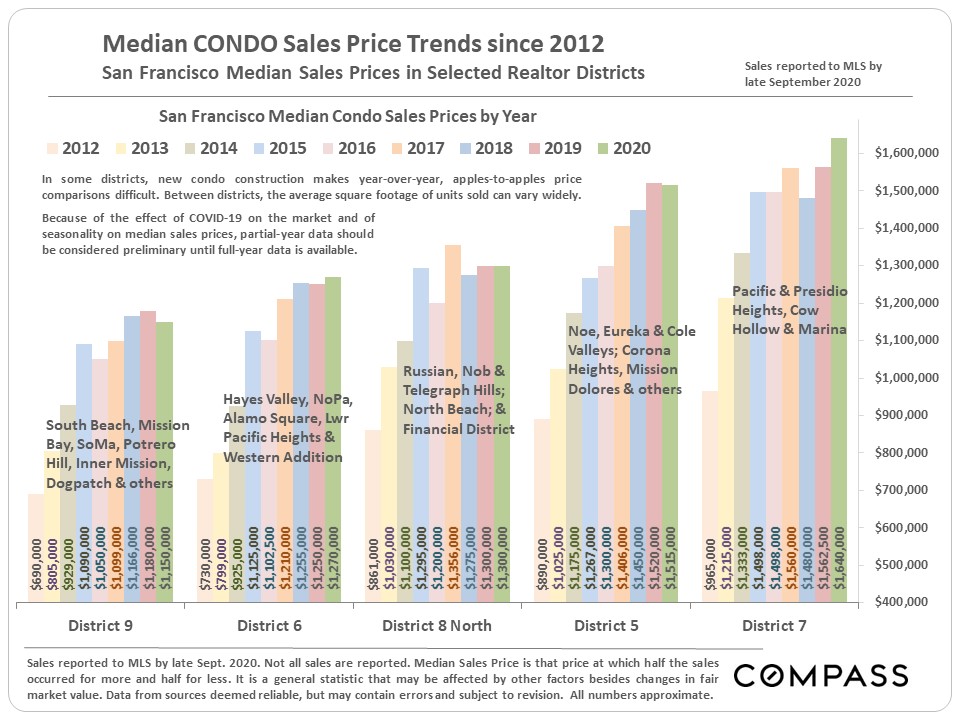
Median House & Condo Sales Price Trends by District
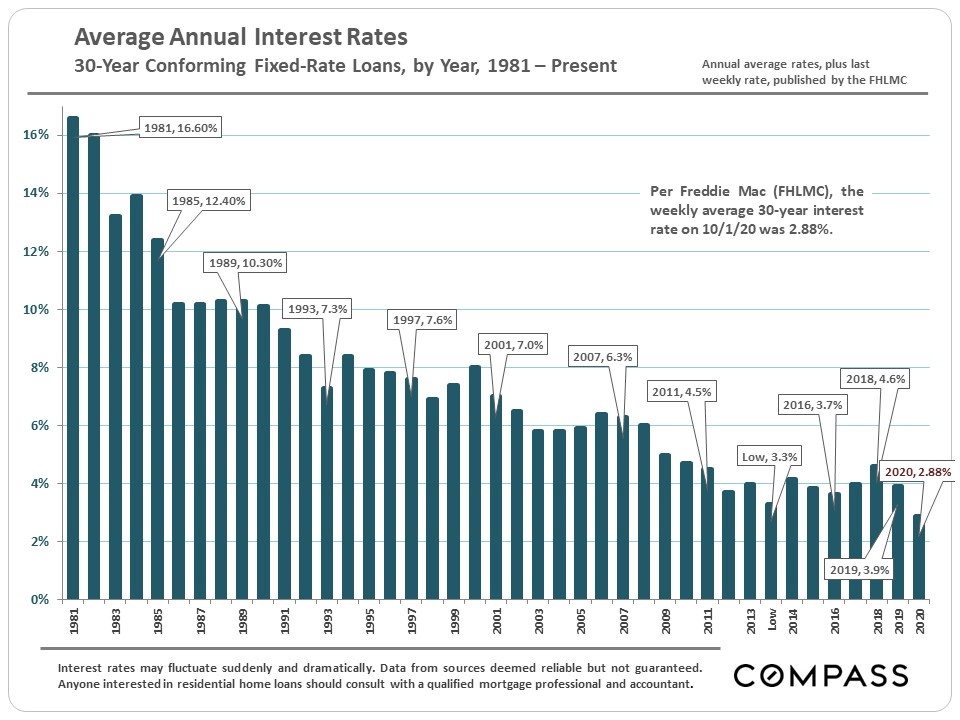
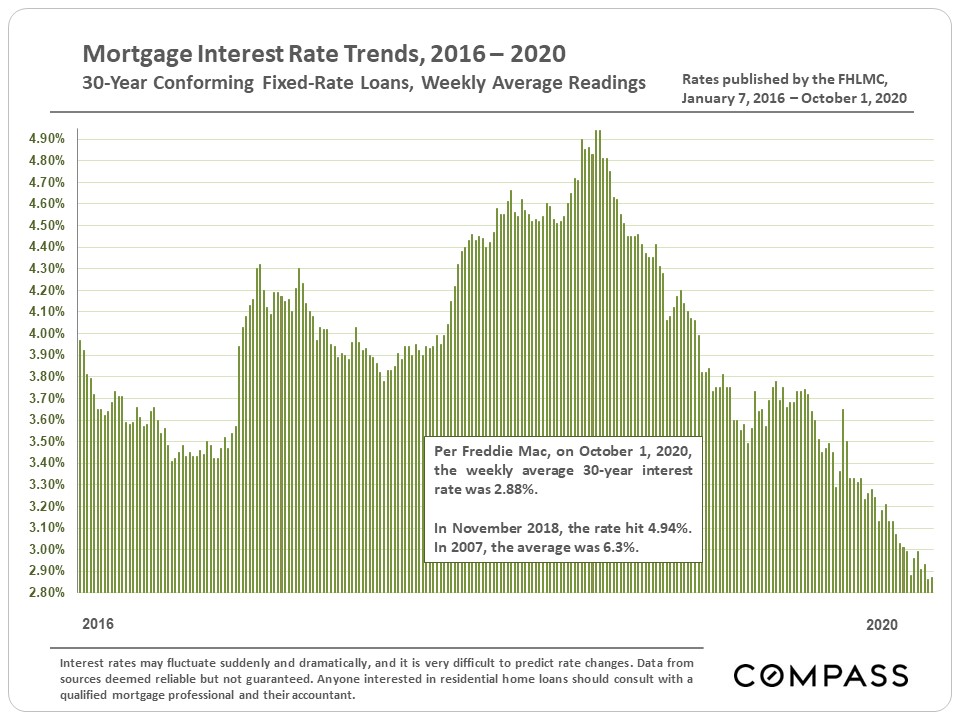
Interest Rates at All-Time Low...Again
The information herein is based on or derived from information generally available to the public and/or from sources believed to be reliable. No representation or warranty can be given with respect to the accuracy or completeness of the information.